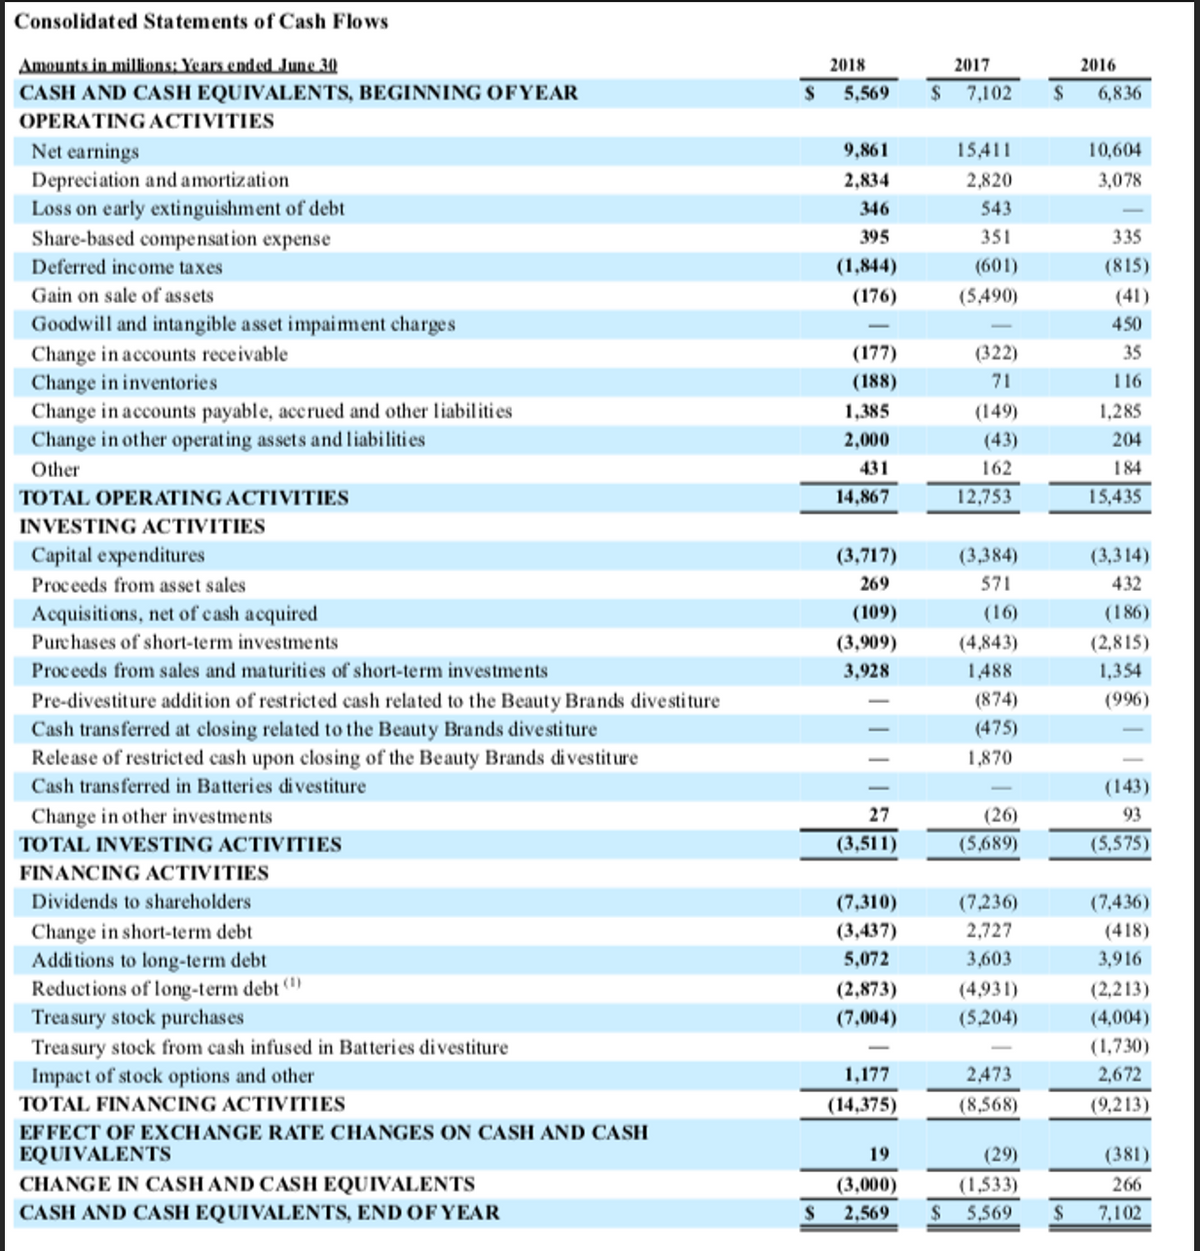
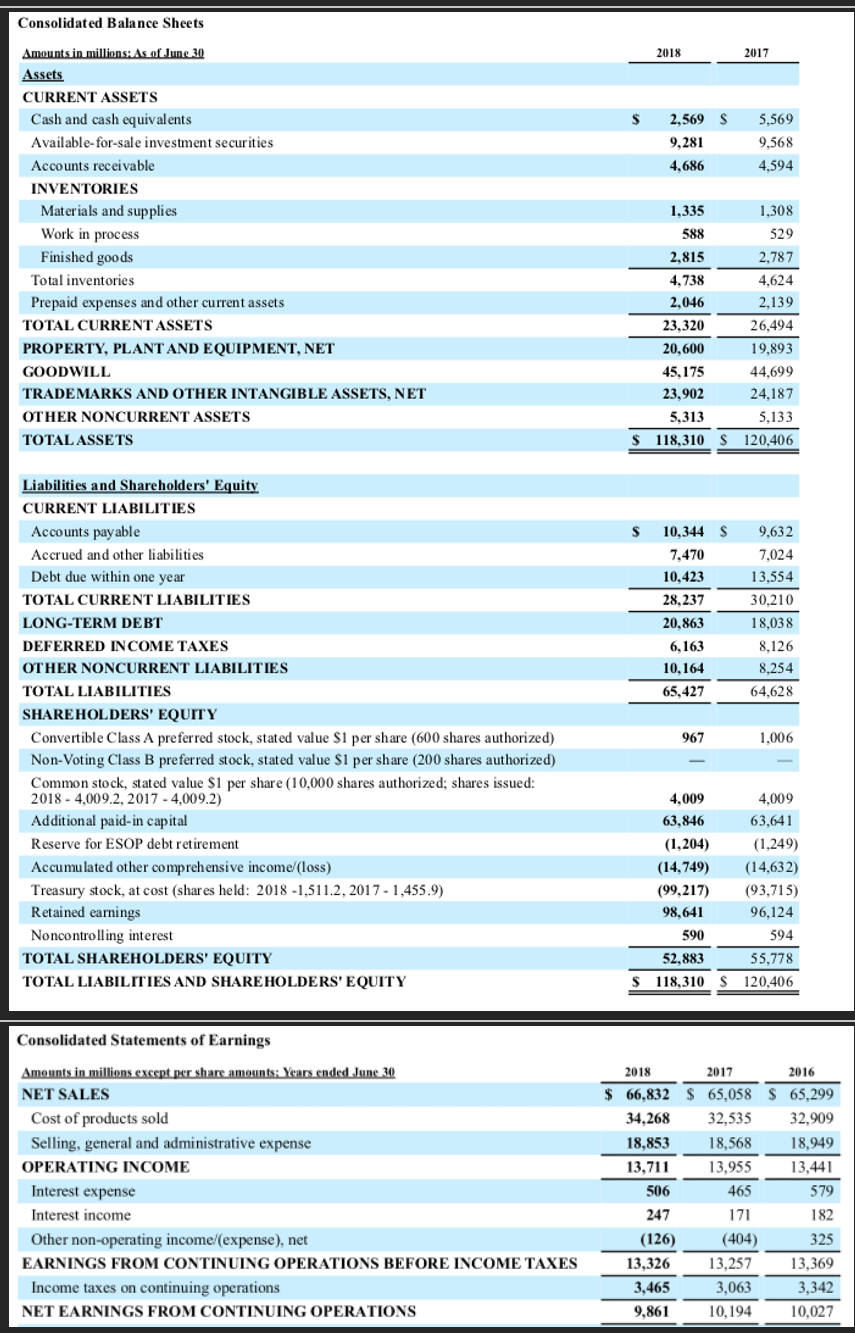
What were Days Inventory for Procter and Gamble in 2018? Question 1 options: 25.9 days 100.3 days 34.1 days 74.3 days 50.5 days Question 2 Capital expenditures for Procter and Gamble in 2018 were. Round to nearest $billion and use the $ symbol. Do not show as a negative number. ____________ What was EBITDA for Procter and Gamble in 2018? Question 6 options: $16,666mm $9,861mm $66,832mm $23,454mm For Procter and Gamble, what was the Gross Margin Percentage for 2018? Round to nearest one decimal point and use the % symbol. _______? For Procter and Gamble, what were days Receivable for 2018? Round to the nearest day and answer in the form of 54 days _______? Return on Sales for Procter and Gamble for 2018 was: (round to nearest whole number and use % symbol.) Hint....Net income is the bottom line of the income statement. ? Total sales (a.k.a. Net Sales) for Procter and Gamble in 2018 were:____. Round to nearest $ billion and use the $ sign...( hint is there are two digits...no commas) Operating income for Procter and Gamble in 2018 was: Round to nearest $billion and use $ symbol. (i.e. if the calculator answer is $1,750,000,000, then place $2 in D2L) What was the return on assets for Procter and Gamble for 2018? Round to nearest one decimal point and use the % symbol. For Procter and Gamble, what was fixed charge coverage for 2018. Your answer should round to the nearest one decimal point and be in the form of....8.3x. In other words, use the x at the end of your answer.


What were Days Inventory for Procter and Gamble in 2018?
Question 1 options:
|
|
25.9 days |
|
|
100.3 days |
|
|
34.1 days |
|
|
74.3 days |
|
|
50.5 days |
Question 2 Capital expenditures for Procter and Gamble in 2018 were. Round to nearest $billion and use the $ symbol. Do not show as a negative number. ____________
What was EBITDA for Procter and Gamble in 2018?
Question 6 options:
|
|
$16,666mm |
|
|
$9,861mm |
|
|
$66,832mm |
|
|
$23,454mm |
For Procter and Gamble, what was the Gross Margin Percentage for 2018? Round to nearest one decimal point and use the % symbol. _______?
For Procter and Gamble, what were days Receivable for 2018? Round to the nearest day and answer in the form of 54 days _______?
Return on Sales for Procter and Gamble for 2018 was: (round to nearest whole number and use % symbol.) Hint....Net income is the bottom line of the income statement. ?
Total sales (a.k.a. Net Sales) for Procter and Gamble in 2018 were:____. Round to nearest $ billion and use the $ sign...( hint is there are two digits...no commas)
Operating income for Procter and Gamble in 2018 was: Round to nearest $billion and use $ symbol. (i.e. if the calculator answer is $1,750,000,000, then place $2 in D2L)
What was the return on assets for Procter and Gamble for 2018? Round to nearest one decimal point and use the % symbol.
For Procter and Gamble, what was fixed charge coverage for 2018. Your answer should round to the nearest one decimal point and be in the form of....8.3x. In other words, use the x at the end of your answer.


Trending now
This is a popular solution!

Step by step
Solved in 4 steps


