What will be the correlation Coefficient, R for the calibration graph above and what does it mean with respect to the graphed components on X and Y axis?
What will be the correlation Coefficient, R for the calibration graph above and what does it mean with respect to the graphed components on X and Y axis?

Glencoe Algebra 1, Student Edition, 9780079039897, 0079039898, 2018
18th Edition
ISBN:9780079039897
Author:Carter
Publisher:Carter
Chapter4: Equations Of Linear Functions
Section4.5: Correlation And Causation
Problem 2AGP

Related questions
Question
Transcribed Image Text:Question 17
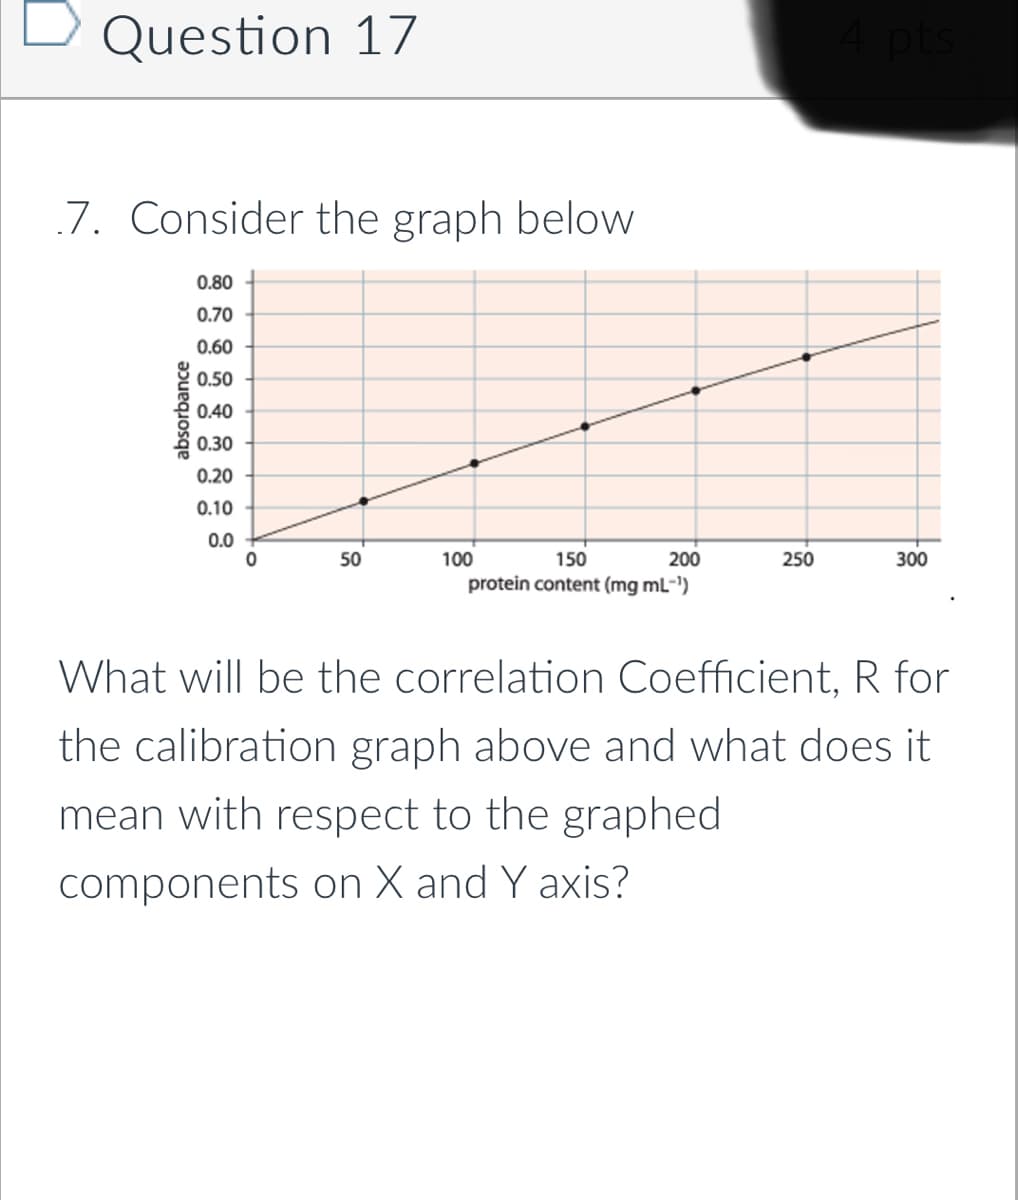
7. Consider the graph below
absorbance
0.80
0.70
0.60
0.50
0.40
0.30
0.20
0.10
0.0
0
50
150
200
protein content (mg mL-¹)
100
250
4 pts
300
What will be the correlation Coefficient, R for
the calibration graph above and what does it
mean with respect to the graphed
components on X and Y axis?
Expert Solution
This question has been solved!
Explore an expertly crafted, step-by-step solution for a thorough understanding of key concepts.

Step by step
Solved in 2 steps

Recommended textbooks for you
Glencoe Algebra 1, Student Edition, 9780079039897…
Algebra
ISBN:
9780079039897
Author:
Carter
Publisher:
McGraw Hill

Big Ideas Math A Bridge To Success Algebra 1: Stu…
Algebra
ISBN:
9781680331141
Author:
HOUGHTON MIFFLIN HARCOURT
Publisher:
Houghton Mifflin Harcourt
Glencoe Algebra 1, Student Edition, 9780079039897…
Algebra
ISBN:
9780079039897
Author:
Carter
Publisher:
McGraw Hill
Big Ideas Math A Bridge To Success Algebra 1: Stu…
Algebra
ISBN:
9781680331141
Author:
HOUGHTON MIFFLIN HARCOURT
Publisher:
Houghton Mifflin Harcourt