What would be your decision based on your p-value Reject Ho since the p-value > 0.1 Reject Ho since the p-value < 0.1
What would be your decision based on your p-value Reject Ho since the p-value > 0.1 Reject Ho since the p-value < 0.1

MATLAB: An Introduction with Applications
6th Edition
ISBN:9781119256830
Author:Amos Gilat
Publisher:Amos Gilat
Chapter1: Starting With Matlab
Section: Chapter Questions
Problem 1P

Related questions

Topic Video
Question
100%
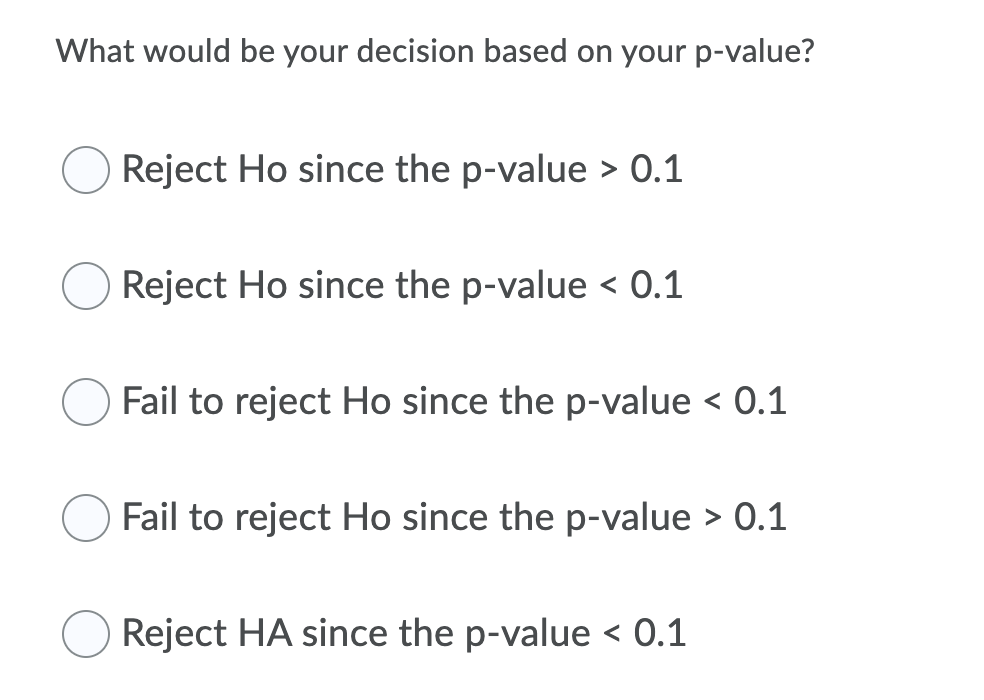
Transcribed Image Text:What would be your decision based on your p-value?
Reject Ho since the p-value > 0.1
Reject Ho since the p-value < 0.1
Fail to reject Ho since the p-value < 0.1
Fail to reject Ho since the p-value > 0.1
Reject HA since the p-value < 0.1
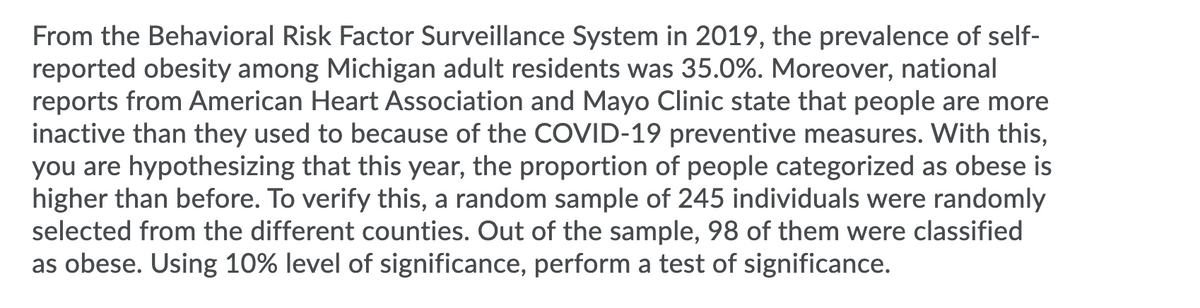
Transcribed Image Text:From the Behavioral Risk Factor Surveillance System in 2019, the prevalence of self-
reported obesity among Michigan adult residents was 35.0%. Moreover, national
reports from American Heart Association and Mayo Clinic state that people are more
inactive than they used to because of the COVID-19 preventive measures. With this,
you are hypothesizing that this year, the proportion of people categorized as obese is
higher than before. To verify this, a random sample of 245 individuals were randomly
selected from the different counties. Out of the sample, 98 of them were classified
as obese. Using 10% level of significance, perform a test of significance.
Expert Solution
This question has been solved!
Explore an expertly crafted, step-by-step solution for a thorough understanding of key concepts.

This is a popular solution!

Trending now
This is a popular solution!

Step by step
Solved in 2 steps with 3 images

Knowledge Booster


Learn more about
Need a deep-dive on the concept behind this application? Look no further. Learn more about this topic, statistics and related others by exploring similar questions and additional content below.Recommended textbooks for you
MATLAB: An Introduction with Applications
Statistics
ISBN:
9781119256830
Author:
Amos Gilat
Publisher:
John Wiley & Sons Inc

Probability and Statistics for Engineering and th…
Statistics
ISBN:
9781305251809
Author:
Jay L. Devore
Publisher:
Cengage Learning

Statistics for The Behavioral Sciences (MindTap C…
Statistics
ISBN:
9781305504912
Author:
Frederick J Gravetter, Larry B. Wallnau
Publisher:
Cengage Learning
MATLAB: An Introduction with Applications
Statistics
ISBN:
9781119256830
Author:
Amos Gilat
Publisher:
John Wiley & Sons Inc
Probability and Statistics for Engineering and th…
Statistics
ISBN:
9781305251809
Author:
Jay L. Devore
Publisher:
Cengage Learning
Statistics for The Behavioral Sciences (MindTap C…
Statistics
ISBN:
9781305504912
Author:
Frederick J Gravetter, Larry B. Wallnau
Publisher:
Cengage Learning

Elementary Statistics: Picturing the World (7th E…
Statistics
ISBN:
9780134683416
Author:
Ron Larson, Betsy Farber
Publisher:
PEARSON

The Basic Practice of Statistics
Statistics
ISBN:
9781319042578
Author:
David S. Moore, William I. Notz, Michael A. Fligner
Publisher:
W. H. Freeman

Introduction to the Practice of Statistics
Statistics
ISBN:
9781319013387
Author:
David S. Moore, George P. McCabe, Bruce A. Craig
Publisher:
W. H. Freeman