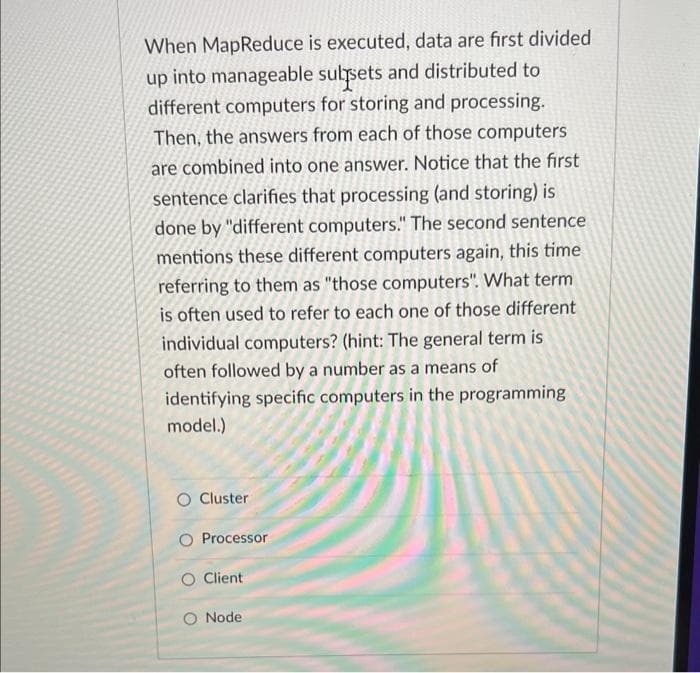
When MapReduce is executed, data are first divided up into manageable subsets and distributed to different computers for storing and processing. Then, the answers from each of those computers are combined into one answer. Notice that the first sentence clarifies that processing (and storing) is done by "different computers." The second sentence mentions these different computers again, this time referring to them as "those computers". What term is often used to refer to each one of those different individual computers? (hint: The general term is often followed by a number as a means of identifying specific computers in the programming model.) O Cluster O Processor O Client O Node
Q: Chapter 3 11) Draw an example of two boxplots on the same graph, labeled as Population 1 and…
A: Note: As per the request, answer is provided for question 11 only. In this solution, we will…
Q: You wish to test Ho: μ₁ = μ2 versus H₁ : μ₁ μ₂ at α = 0.05. You obtain a sample of size n₁ = 15 with…
A: From the provided information,
Q: 1. Consider the normal distribution of IQs with a mean of 100 and a standard deviation of 16. What…
A: given data, normal distributionμ=100σ=16we have to find out the given probabilities.
Q: A survey of 225 randomly chosen commuters are asked if they support an expanded public…
A:
Q: 6. The table shows the variation of the relative thermal conductivity k of sodium with temperature…
A: This question involves finding the quadratic that fits the data of the relative thermal conductivity…
Q: X; 0 2 5 The empirical distribution of some variable X is given by the following table. (x, are…
A:
Q: Find the missing regression coefficients of the Minitab results. 2.What regression model will you…
A: The partial MINITAB output of the multiple regression is given. Given that, Response variable = PROD…
Q: What are the mean and the standard deviation for the sampling distribution of the sample proportion?
A: Given that, Sample size (n) = 100 Population proportion (p) = 0.60 q = 1-p = 1-0.60 = 0.40 To find…
Q: A researcher wishes to estimate, with 90% confidence, the population proportion of motor vehicle…
A: given data, confidence interval =0.90α=1-0.90=0.10Z-critical value=?margin of error=Ehere E=3%=0.03…
Q: In a random sample of 65 trout, the average weight is 2 pounds, with standard deviation(s) = 0.5,…
A: Answer: From the given data, sample size(n) =65 standard deviation(s) = 0.5 1)sample mean (x) = 2…
Q: A Texile factory uses a 43 liter bucket of dye per 1 roll of fabric that is 1,067 feet long. If the…
A:
Q: The weather in Columbus is either good, indifferent, or bad on any given day. If the weather is good…
A: The transition matrix of change in weither is given as: P=GoodIndifferentBadGoodIndifferentBad0.4…
Q: Consider a regression analysis with n=51 and four potential independent variables. Suppose that one…
A: This question involves understanding the relationship between correlation and the Student's t…
Q: (a) A population has a mean of 0.937 and a standard deviation of 0.006. Find the percentage of…
A: We have given that Mean=M=0.937, Standard deviation=S=0.006
Q: usage with a A 5.000 mAh cellphone battery is enough to last a normally mean of 5.5 hours of gaming…
A: Given that: Population mean, μ=5.5 Population standard deviation, σ=0.8
Q: Do part (a), (e), (f), (g); i.e. only calculate mean, standard deviation, variance, and coefficient…
A: We have given data, 0.90 1.42 1.30 1.55 1.63 1.32 1.35 1.47 1.95 1.66 1.96 1.47 1.92 1.35…
Q: The following are the scores of 15 students on an algebra test. Identify a cumulative frequency…
A: Given that 70,70,72,73,73,74,75,76,81,82,82,82,84,84,94 Sample size n =15
Q: The following data contains days when road rage occurred according to a study. The goal of the study…
A: Mode: It is the most frequently occurred value.
Q: P If n=540 and (p-hat) =0.45, find the margin of error at a 99% confidence level ***** ******* ** O…
A: Answer: From the given data, sample size(n) = 540 p^ = 0.45 99% confidence interval, significance…
Q: The mean of a population of raw scores is 28 (Sx = 9). Your X̅= 34 (with N=35). Using the .05…
A: Suppose μ is the population mean.
Q: The length of human pregnancies is approximately normal with mean μ=266 days and standard deviation…
A: Answer:- Given, The length of human pregnancies is approximately normal with mean μ=266 days and…
Q: 6. The following table and graph show retail sales in drug stores, S, in billions of dollars in the…
A: Please note that as per our guidelines if multiple sub-parts are there in a question we can answer…
Q: The chickens at Colonel Thompson's Ranch have a mean weight of 1950 g, with a standard deviation of…
A: We have given information, Let X=The weights of the chicken The weights of the chicken are closely…
Q: Data Group 67 72 65 69 71 62 64 71 67 71 75 68 73 59 64 67 63 68 70 A A A A A B B B B с C C с D D D…
A: Solution: From the given information, Data Group 67 A 72 A 65 A 69 A…
Q: You wish to test if the mean difference of post-test from pre-test is less than significance level…
A: According to the given information in this question We need to find the critical value by R
Q: The number of tornadoes in Wellsville County follows a Poisson distribution with an average of 2.2…
A: Given that The average of poisson probability distribution is λ=2.2 a year.
Q: Random samples of resting heart rates are taken from two groups. Population 1 exercises regularly,…
A: Given data: Population 1 Population 2 66 70 71 68 69 77 73 78 66 75 66 77 65 71…
Q: Suppose that 15% of the population of the U.S. is left-handed. If a random sample of 145 people from…
A:
Q: Using these three plots, determine which type of model would be the best type: Linear exponential.…
A: The answer to your question is as given in steps below.
Q: Consider the following marks obtained by 20 students in a quantitative methods class test. 64 89 63…
A: Given that: 64, 89, 63, 61, 8, 87, 74, 72, 54, 8862, 81, 78, 73, 63, 56, 83, 86, 83, 93
Q: Help with answe please
A: Given data : A B C D Order accurate 339 280 243 139 Order not accurate 34 50 37 19…
Q: A steak at a restaurant actually weighs 15 ounces (the true value), but the menu claims that it is a…
A: Given data : True value = 15 Measured value = 13
Q: 2. Which of these follows a geometric distribution? a. The number of black cards present in a hand…
A: Three important conditions for geometric distribution: (1) All observations are independent to each…
Q: Exercise 16. The x²(v) distribution is a special case of Gamma distribution (not to be con- fused…
A:
Q: (a) find k such that f(x) is a PMF for X. (b) find P[X < 2.75]. (c) find the mean and variance of X.…
A:
Q: Records of randomly selected births were obtained and categorized according to the day of the week…
A: Given that We have to test hypothesis for the claim that births occur on the different days with…
Q: Exercise 17. Let X₁,..., Xn~ N(u, o2) be i.i.d. where u is known, but o2 is unknown. Consider the…
A: Since you have asked multiple questions, we will solve the first question for you. If you want any…
Q: Assume that females have pulse rates that are normally distributed with a mean of u = 75.0 beats per…
A: Suppose the random variable x defines the pulse rate of females.
Q: A graduate student is interested in whether journaling can affect grief and healing. For her study,…
A: i). This is a two tailed test ii) The critical region is/are ±2.011 iii) The estimated standard…
Q: Suppose a simple random sample of size n=10 is obtained from a population with μ=68 and σ=19. Answer…
A: GivenMean(μ)=68standard deviation(σ)=19sample size(n)=10
Q: 9. Suppose that you are the manager at a manufacturing plant that produces metal ball bearings. The…
A: 9. The mean is 5mm and standard deviation is 0.02mm.
Q: Susan has been on a bowling team for 14 years. After examining all of her scores over that period of…
A: The mean is 225 and standard deviation is 13.
Q: 1. ) According to the PayScale data from 2021, the average starting salaries by college major for…
A: The study aims to investigate if there is a difference in starting salaries by college majors in the…
Q: There are six computers for student use in the Math Lab. The number of computers available at noon…
A: Since you have posted a question with multiple sub parts, we will provide the solution only to the…
Q: Use the data in the following table, which lists drive-thru order accuracy at popular fast food…
A: A B C D Total order Accurate 339 280 243 139 1001 order Not Accurate 34 50 37 19 140…
Q: Consider the statistical discrimination graph of how the signal y relates to the employers 'best…
A: Given information: Given data represents the statistical discrimination graph of the signal y…
Q: 2. Approximately 11% of all people are left-handed. Consider 20 randomly selected students. In the…
A: Let, X be the number of left-handed people/students. Then X~Binomial(n=20 , p = 0.11)
Q: Suppose the true proportion of voters in the county who support a restaurant tax is 0.57. Consider…
A: The information provided in the question are as follows : Population proportion (p) = 0.57 And…
Q: 4. Differentiating pooled variance and the estimated standard error of the difference in sample…
A: Sample sizes, sample means, and sample standard deviations are given. We were asked to find pooled…
Q: The average weight of 20 students in a certain school was found to be 165lbs with a standard…
A: The sample size is 20 The sample mean is 165 lbs The sample standard deviation is 4.5 We have to…
Trending now
This is a popular solution!
Step by step
Solved in 2 steps
- Let's assume that there are 500 people in a population. The researcher has access to all 500 participants, and sends a questionnaire that is accessed by a hyperlink. Of the 500 possible subjects, 485 complete it. Does this mean that the results generated from this study will be highly-accurate? What might cause the study to be unreliable?There's a math processing error on G and H, could you please fix that?To the Internal Revenue Service, the reasonableness of total itemized deductions depends on the taxpayer's adjusted gross income. Large deductions, which include charity and medical deductions, are more reasonable for taxpayers with large adjusted gross incomes. If a taxpayer claims larger than average itemized deductions for a given level of income, the chances of an IRS audit are increased. Data (in thousands of dollars) on adjusted gross income and the average or reasonable amount of itemized deductions follow. Adjusted Gross Income($1,000s) Itemized Deductions($1,000s) 22 9.6 27 9.6 32 10.1 48 11.1 65 11.5 85 19.7 120 23.5 (a) Develop a scatter diagram for these data with adjusted gross income as the independent variable. A scatter diagram has 7 points plotted on it. The horizontal axis ranges from 0 to 140 and is labeled: Adjusted Gross Income ($1,000s). The vertical axis ranges from 0 to 30 and is labeled: Itemized Deductions ($1,000s). The points are…
- To the Internal Revenue Service, the reasonableness of total itemized deductions depends on the taxpayer's adjusted gross income. Large deductions, which include charity and medical deductions, are more reasonable for taxpayers with large adjusted gross incomes. If a taxpayer claims larger than average itemized deductions for a given level of income, the chances of an IRS audit are increased. Data (in thousands of dollars) on adjusted gross income and the average or reasonable amount of itemized deductions follow. Adjusted Gross Income($1,000s) Itemized Deductions($1,000s) 22 9.6 27 9.6 32 10.1 48 11.1 65 13.5 85 19.7 120 27.5 (a) Develop a scatter diagram for these data with adjusted gross income as the independent variable. (b) Use the least squares method to develop the estimated regression equation that can be used to predict itemized deductions (in $1,000s) given the adjusted gross income (in $1,000s). (Round your numerical values to three decimal…A fleet of 100 taxis is divided into two groups of 50 cars each to see whether premium gasoline reduces maintenance costs. Premium unleaded fuel is used in group A, while regular unleaded fuel is used in group B. The total maintenance cost for each vehicle during a one-year period is recorded. Premium fuel will be used if it is shown to reduce maintenance costs.A professional employee in a large corporation receives an average of μ = 38.8 e-mails per day. Most of these e-mails are from other employees in the company. Because of the large number of e-mails, employees find themselves distracted and are unable to concentrate when they return to their tasks. In an effort to reduce distraction caused by such interruptions, one company established a priority list that all employees were to use before sending an e-mail. One month after the new priority list was put into place, a random sample of 39 employees showed that they were receiving an average of x = 31 e-mails per day. The computer server through which the e-mails are routed showed that σ = 15.4. Has the new policy had any effect? Use a 5% level of significance to test the claim that there has been a change (either way) in the average number of e-mails received per day per employee. What are the null and alternate hypotheses? Question 8 options: H0 : μ ≠ 38.8 e-mails; H1 : μ…
- How is this set upBecause of restrictions placed on individuals leaving their homes, many families are pre-ordering their meals for an entire month (30 days) from innovative providers and having them delivered at various intervals during the month (e.g., every 4 days). This one provider only provides dinners (which require some preparations by the family) and also requires families to select and prepay for the 30 meals per order. It offers seven different meals per month. The following table lists these seven meals along with a very brief description of each and its costs (per family member). Each meal is given a symbol which also serves as the symbol for its decision variable (e.g. C1: chicken with salad) representing how many meals of that type to order when formulating your model) Meal Description cost/family member C1 Chicken with salad $10 C2 Chicken with hot vegetables $11 R1 Red meat (beef or pork) with salad $12 R2 Red meat (beef or pork) with hot vegetables $13 F1 Fish/seafood…What is the qoutient
- The head of the department of management at State University has noticed that the four secretaries in the departmentaloffice seem to spend a lot of time answering questions fromstudents that could better be answered by the college advising office, by faculty advisors, or simply from the availableliterature; that is, course schedules, catalogues, the studenthandbook, and so on. As a result, the department head isconsidering remodeling the office with cubicles so studentsdo not have easy access to the secretaries. However, beforeinvesting in this project the head has decided to conduct awork sampling study to determine the proportion of timethe secretaries spend assisting students. The head arrangedfor a graduate assistant to make observations for the worksample, but the graduate student’s schedule enabled her tomake only 300 random observations in the time allotted forthe study. The results of the work sampling study showedthat the secretaries assisted students 12% of the time, somewhat…A professional employee in a large corporation receives an average of 44.8 e-mails per day. Most of these e-mails are from other employees in the company. Because of the large number of e-mails, employees find themselves distracted and are unable to concentrate when they return to their tasks. In an effort to reduce distraction caused by such interruptions, one company established a priority list that all employees were to use before sending an e-mail. One month after the new priority list was put into place, a random sample of 43 employees showed that they were receiving an average of x= 36.8 e-mails per day. The computer server through which the e-mails are routed showed that s.d= 19.2. Use a 10% level of significance to test the claim that there has been a change (either way) in the average number of e-mails received per day per employee. Find (or estimate) the P-value. Round your answer to three decimal places.A professional employee in a large corporation receives an average of 40.0 e-mails per day. Most of these e-mails are from other employees in the company. Because of the large number of e-mails, employees find themselves distracted and are unable to concentrate when they return to their tasks. In an effort to reduce distraction caused by such interruptions, one company established a priority list that all employees were to use before sending an e-mail. One month after the new priority list was put into place, a random sample of 49 employees showed that they were receiving an average of X(bar)= 30.4 e-mails per day. The computer server through which the e-mails are routed showed that s.d.= 16.5 . Use a 5% level of significance to test the claim that there has been a change (either way) in the average number of e-mails received per day per employee. What is the value of the test statistic? Round your answer to three decimal places.