When people learn a new task, their performance usually improves when they are tested the next day, but only if they get 6 hours sleep (Sticckgold, et al., 2000). The following data demonstrate this phenomenon.  The participants learned

Algebra: Structure And Method, Book 1
(REV)00th Edition
ISBN:9780395977224
Author:Richard G. Brown, Mary P. Dolciani, Robert H. Sorgenfrey, William L. Cole
Publisher:Richard G. Brown, Mary P. Dolciani, Robert H. Sorgenfrey, William L. Cole
Chapter7: Applying Fractions
Section7.2: Proportions
Problem 48WE
icon
Related questions
Topic Video
Question

When people learn a new task, their performance usually improves when they are tested the next day, but only if they get 6 hours sleep (Sticckgold, et al., 2000). The following data demonstrate this phenomenon.  The participants learned a visual discrimination task on one day.  Half of the participants were allowed to have at least 6 hours of sleep and the other half were kept awake all night.  

                                      6 hours sleep                                   No sleep

                                           n =14                                                  n = 14

                                          M = 72                                                M =65

                                          SS = 932                                            SS = 706

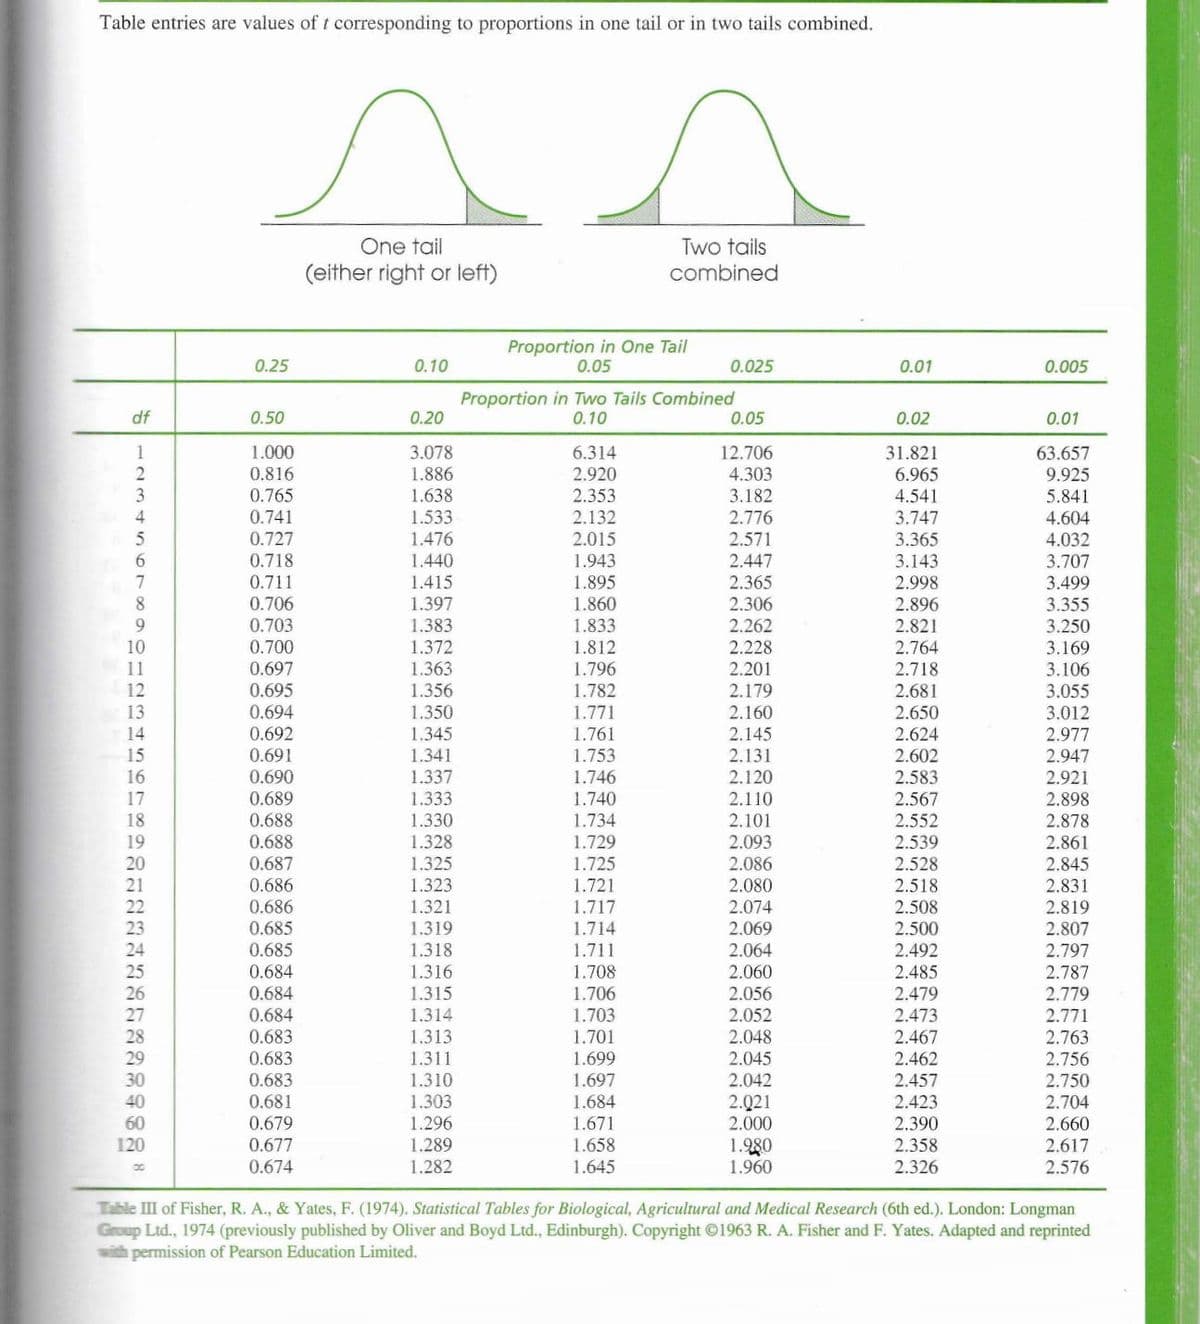
Is there a significant difference between the two conditions?   Use a two-tailed test with α = .01.

n =

df1 + df

M1=

M2=

μ12 =

SS1 + SS2=

s2p =

S(M1-M2) =

Hypothesis:

Locate critical region for stated alpha:

Compute test statistic:

Make a decision about the null hypothesis and state a conclusion:


Table entries are values of t corresponding to proportions in one tail or in two tails combined.
Two tails
combined
One tail
(either right or left)
Proportion in One Tail
0.05
0.25
0.10
0.025
0.01
0.005
Proportion in Two Tails Combined
0.10
df
0.50
0.20
0.05
0.02
0.01
1
1.000
3.078
1.886
6.314
12.706
31.821
63.657
0.816
2.920
4.303
3.182
6.965
9.925
3
0.765
1.638
2.353
5.841
4.604
4.032
3.707
3.499
4.541
0.741
1.533
2.132
2.776
3.747
1.476
1.440
2.571
2.447
0.727
2.015
3.365
0.718
0.711
1.943
3.143
7
1.415
1.895
2.365
2.998
1.397
1.383
1.372
1.363
1.356
8.
0.706
1.860
2.306
2.262
2.896
3.355
9.
0.703
1.833
2.821
3.250
1.812
1.796
0.700
0.697
0.695
0.694
10
2.228
2.764
3.169
11
2.201
2.718
2.681
2.650
3.106
12
1.782
2.179
3.055
13
1.350
1.771
2.160
3.012
0.692
1.345
1.761
1.753
1.746
1.740
14
2.145
2.624
2.977
0.691
0.690
15
1.341
2.131
2.602
2.947
16
1.337
2.120
2.583
2.921
17
0.689
1.333
2.110
2.567
2.898
0.688
0.688
0.687
18
1.330
1.734
2.101
2.552
2.878
1.729
1.725
19
1.328
2.093
2.539
2.861
1.325
1.323
20
2.086
2.528
2.845
2.518
2.508
21
0.686
1.721
2.080
2.831
0.686
0.685
0.685
0.684
0.684
0.684
0.683
0.683
1.321
1.717
2.074
2.819
1.319
1.714
2.500
2.069
2.064
2.807
1.318
1.711
2.492
2.797
2.787
1.708
1.706
2.485
2.479
2.473
1.316
2.060
1.315
1.314
1.313
2.056
2.779
2.052
2.048
1.703
2.771
2.763
2.756
2.750
1.701
2.467
1.311
1.699
1.697
1.684
1.671
1.658
1.645
2.045
2.462
0.683
0.681
0.679
1.310
2.042
2.457
1.303
1.296
1.289
2.Q21
2.000
2.423
2.390
2.358
2.704
60
2.660
120
0.677
1.980
1.960
2.617
0.674
1.282
2.326
2.576
Table III of Fisher, R. A., & Yates, F. (1974). Statistical Tables for Biological, Agricultural and Medical Research (6th ed.). London: Longman
Group Ltd., 1974 (previously published by Oliver and Boyd Ltd., Edinburgh). Copyright ©1963 R. A. Fisher and F. Yates. Adapted and reprinted
with permission of Pearson Education Limited.
Transcribed Image Text:Table entries are values of t corresponding to proportions in one tail or in two tails combined. Two tails combined One tail (either right or left) Proportion in One Tail 0.05 0.25 0.10 0.025 0.01 0.005 Proportion in Two Tails Combined 0.10 df 0.50 0.20 0.05 0.02 0.01 1 1.000 3.078 1.886 6.314 12.706 31.821 63.657 0.816 2.920 4.303 3.182 6.965 9.925 3 0.765 1.638 2.353 5.841 4.604 4.032 3.707 3.499 4.541 0.741 1.533 2.132 2.776 3.747 1.476 1.440 2.571 2.447 0.727 2.015 3.365 0.718 0.711 1.943 3.143 7 1.415 1.895 2.365 2.998 1.397 1.383 1.372 1.363 1.356 8. 0.706 1.860 2.306 2.262 2.896 3.355 9. 0.703 1.833 2.821 3.250 1.812 1.796 0.700 0.697 0.695 0.694 10 2.228 2.764 3.169 11 2.201 2.718 2.681 2.650 3.106 12 1.782 2.179 3.055 13 1.350 1.771 2.160 3.012 0.692 1.345 1.761 1.753 1.746 1.740 14 2.145 2.624 2.977 0.691 0.690 15 1.341 2.131 2.602 2.947 16 1.337 2.120 2.583 2.921 17 0.689 1.333 2.110 2.567 2.898 0.688 0.688 0.687 18 1.330 1.734 2.101 2.552 2.878 1.729 1.725 19 1.328 2.093 2.539 2.861 1.325 1.323 20 2.086 2.528 2.845 2.518 2.508 21 0.686 1.721 2.080 2.831 0.686 0.685 0.685 0.684 0.684 0.684 0.683 0.683 1.321 1.717 2.074 2.819 1.319 1.714 2.500 2.069 2.064 2.807 1.318 1.711 2.492 2.797 2.787 1.708 1.706 2.485 2.479 2.473 1.316 2.060 1.315 1.314 1.313 2.056 2.779 2.052 2.048 1.703 2.771 2.763 2.756 2.750 1.701 2.467 1.311 1.699 1.697 1.684 1.671 1.658 1.645 2.045 2.462 0.683 0.681 0.679 1.310 2.042 2.457 1.303 1.296 1.289 2.Q21 2.000 2.423 2.390 2.358 2.704 60 2.660 120 0.677 1.980 1.960 2.617 0.674 1.282 2.326 2.576 Table III of Fisher, R. A., & Yates, F. (1974). Statistical Tables for Biological, Agricultural and Medical Research (6th ed.). London: Longman Group Ltd., 1974 (previously published by Oliver and Boyd Ltd., Edinburgh). Copyright ©1963 R. A. Fisher and F. Yates. Adapted and reprinted with permission of Pearson Education Limited.
Expert Solution
trending now

Trending now

This is a popular solution!

steps

Step by step

Solved in 4 steps with 8 images

Blurred answer
Knowledge Booster
Hypothesis Tests and Confidence Intervals for Means
Learn more about
Need a deep-dive on the concept behind this application? Look no further. Learn more about this topic, statistics and related others by exploring similar questions and additional content below.
Recommended textbooks for you
Algebra: Structure And Method, Book 1
Algebra
ISBN:
9780395977224
Author:
Richard G. Brown, Mary P. Dolciani, Robert H. Sorgenfrey, William L. Cole
Publisher:
McDougal Littell
Glencoe Algebra 1, Student Edition, 9780079039897…
Algebra
ISBN:
9780079039897
Author:
Carter
Publisher:
McGraw Hill