When people learn a new task, their performance usually improves when they are tested the next day, but only if they get 6 hours sleep (Sticckgold, et al., 2000). The following data demonstrate this phenomenon. The participants learned a visual discrimination task on one day. Half of the participants were allowed to have at least 6 hours of sleep and the other half were kept awake all night. 6 hours sleep No sleep n =14 n = 14 M = 72 M = 65 SS = 932 SS = 706 Will the 6-hour sleep show a much higher performance rate? This time use a one-tail with alpha = .05 Show all of the steps. Remember use the attached t-distribution chart when obtaining your critical region.
When people learn a new task, their performance usually improves when they are tested the next day, but only if they get 6 hours sleep (Sticckgold, et al., 2000). The following data demonstrate this phenomenon. The participants learned a visual discrimination task on one day. Half of the participants were allowed to have at least 6 hours of sleep and the other half were kept awake all night. 6 hours sleep No sleep n =14 n = 14 M = 72 M = 65 SS = 932 SS = 706 Will the 6-hour sleep show a much higher performance rate? This time use a one-tail with alpha = .05 Show all of the steps. Remember use the attached t-distribution chart when obtaining your critical region.

Glencoe Algebra 1, Student Edition, 9780079039897, 0079039898, 2018
18th Edition
ISBN:9780079039897
Author:Carter
Publisher:Carter
Chapter10: Statistics
Section10.4: Distributions Of Data
Problem 20PFA

Related questions
Topic Video
Question
When people learn a new task, their performance usually improves when they are tested the next day, but only if they get 6 hours sleep (Sticckgold, et al., 2000). The following data demonstrate this phenomenon. The participants learned a visual discrimination task on one day. Half of the participants were allowed to have at least 6 hours of sleep and the other half were kept awake all night.
| 6 hours sleep | No sleep |
| n =14 | n = 14 |
| M = 72 | M = 65 |
| SS = 932 | SS = 706 |
Will the 6-hour sleep show a much higher performance rate? This time use a one-tail with alpha = .05 Show all of the steps.
Remember use the attached t-distribution chart when obtaining your critical region.
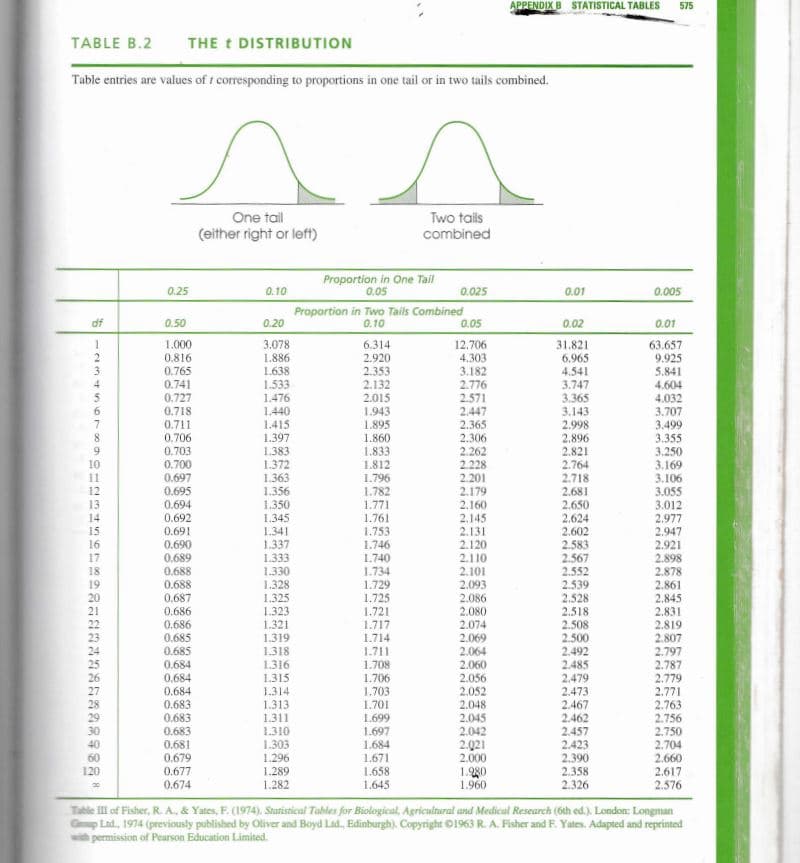
Transcribed Image Text:APPENDIX B STATISTICAL TABLES
575
TABLE B.2
THE t DISTRIBUTION
Table entries are values of t corresponding to proportions in one tail or in two tails combined.
One tail
Two tails
combined
(either right or left)
Proportion in One Tail
0.05
0.25
0.10
0.025
0.01
0.005
Proportion in Two Tails Combined
0.10
df
0.50
0.20
0.05
0.02
0.01
1.000
0.816
0.765
0.741
0.727
3.078
1.886
1.638
12.706
4.303
3.182
2.776
6.314
31.821
2.920
2.353
63.657
9.925
5.841
2.
6.965
4.541
3.747
3.365
3.143
2.998
4.
1.533
0.718
0.711
0.706
1.476
1,440
1.415
2.132
2.015
1.943
1.895
2.571
2.447
2.365
2.306
4.604
4.032
3.707
7.
3.499
3.355
3,250
8.
1.397
1.383
1.860
1.833
1.812
1.796
1.782
2.896
2.821
2.764
2.718
2.681
2.650
2.624
2.602
2.583
0.703
10
11
0.700
0.697
1.372
1.363
1.356
2.262
2.228
2.201
3.169
3.106
3.055
3.012
2.977
2.947
2.921
2.898
2.878
0.695
0.694
12
2.179
2.160
13
1.350
1.345
1.771
1.761
0.692
0.691
0.690
2.145
2.131
2.120
14
1.753
1.746
1.740
1.734
1.729
1.725
1.721
15
16
17
1.341
0.689
0.688
0.688
0.687
1.337
1.333
1.330
1.328
1.325
1.323
18
19
2.110
2.101
2.093
2.567
2.552
2.539
2.861
2.845
2.831
20
21
22
23
2.528
2.518
2.508
2.500
2.492
2.485
2.479
2.473
2.467
2.462
2.457
2.423
2.390
2.358
2.326
2.086
2.080
2.074
2.069
0.686
1.321
1.319
1.318
1.316
1.315
1.314
1.313
1.311
1.310
1.303
1.296
1.289
1.282
0.686
0.685
1.717
1.714
1.711
1.708
2.819
2.807
0.685
2.064
2.060
2.797
0.684
0.684
0.684
2.787
2.779
2.771
1.706
1.703
1.701
2.056
2.052
2.048
2.045
2.042
0.683
0.683
28
29
30
40
60
2.763
2.756
2.750
2.704
2.660
2.617
2.576
1.699
1.697
0.683
0.681
1.684
1.671
1.658
1.645
2.021
2.000
1.280
1.960
0.679
120
0.677
0.674
Table Ill of Fisher, R. A., & Yates, F. (1974). Sturistical Tables for Biological, Agricultural and Medical Research (6th ed.). London: Longman
Gp Lad, 1974 (previously published by Oliver and Boyd Lad, Edinburgh). Copyright O1963 R. A. Fisher and F. Yates. Adapted and reprinted
w permission of Pearson Education Limited.
Expert Solution
This question has been solved!
Explore an expertly crafted, step-by-step solution for a thorough understanding of key concepts.

This is a popular solution!

Trending now
This is a popular solution!

Step by step
Solved in 2 steps

Knowledge Booster


Learn more about
Need a deep-dive on the concept behind this application? Look no further. Learn more about this topic, statistics and related others by exploring similar questions and additional content below.Recommended textbooks for you
Glencoe Algebra 1, Student Edition, 9780079039897…
Algebra
ISBN:
9780079039897
Author:
Carter
Publisher:
McGraw Hill
Glencoe Algebra 1, Student Edition, 9780079039897…
Algebra
ISBN:
9780079039897
Author:
Carter
Publisher:
McGraw Hill