When people learn a new task, their performance usually improves when they are tested the next day, but only if they get 6 hours sleep (Sticckgold, et al., 2000). The following data demonstrate this phenomenon. The participants learned a visual discrimination task on one day. Half of the participants were allowed to have at least 6 hours of sleep and the other half were kept awake all night. 6 hours sleep No sleep n =14 n = 14 M = 72 M =65 SS = 932 SS = 706 Is there a significant difference between the two conditions? Use a two-tailed test with α = .01. Remember use the attached t-distribution chart when obtaining your critical region.


When people learn a new task, their performance usually improves when they are tested the next day, but only if they get 6 hours sleep (Sticckgold, et al., 2000). The following data demonstrate this phenomenon. The participants learned a visual discrimination task on one day. Half of the participants were allowed to have at least 6 hours of sleep and the other half were kept awake all night.
6 hours sleep No sleep
n =14 n = 14
M = 72 M =65
SS = 932 SS = 706
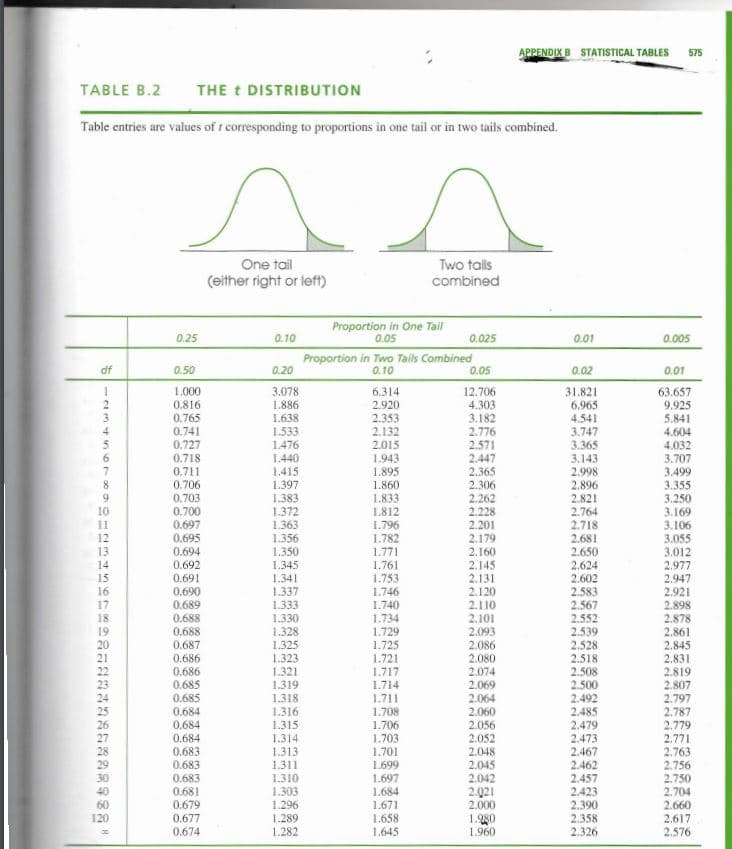
Is there a significant difference between the two conditions? Use a two-tailed test with α = .01.
Remember use the attached t-distribution chart when obtaining your critical region.


Trending now
This is a popular solution!

Step by step
Solved in 2 steps with 6 images


