When testing for heteroscedasticity in a linear regression model it is preferable to use the Breusch-Pagan test, as it is able to detect non-linear forms of heteroscedasticity and has fewer parameters to estimate in the auxiliary regression, compared to the White test.
When testing for heteroscedasticity in a linear regression model it is preferable to use the Breusch-Pagan test, as it is able to detect non-linear forms of heteroscedasticity and has fewer parameters to estimate in the auxiliary regression, compared to the White test.

Trigonometry (MindTap Course List)
8th Edition
ISBN:9781305652224
Author:Charles P. McKeague, Mark D. Turner
Publisher:Charles P. McKeague, Mark D. Turner
Chapter4: Graphing And Inverse Functions
Section: Chapter Questions
Problem 6GP: If your graphing calculator is capable of computing a least-squares sinusoidal regression model, use...

Related questions
Question
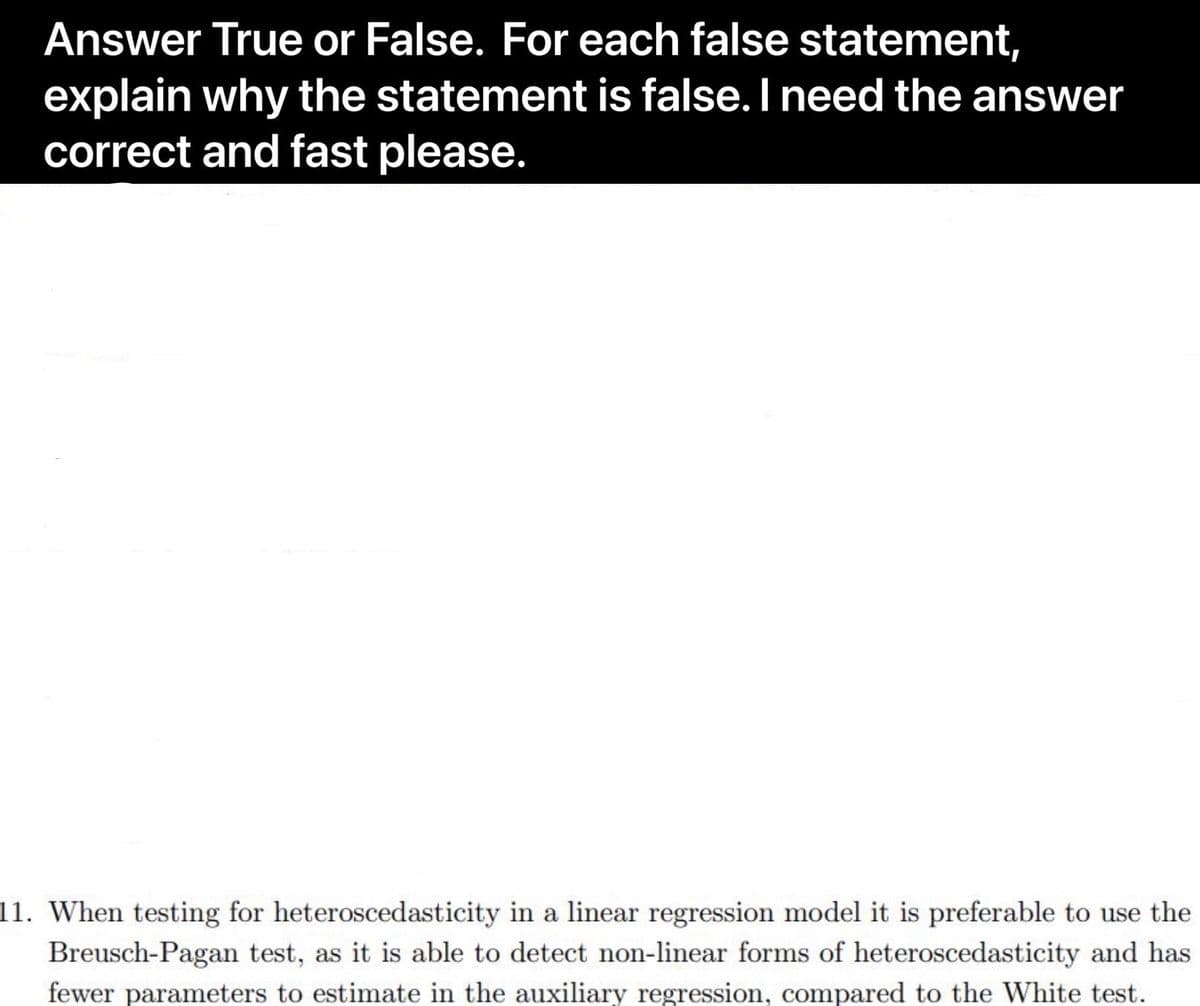
Transcribed Image Text:Answer True or False. For each false statement,
explain why the statement is false. I need the answer
correct and fast please.
11. When testing for heteroscedasticity in a linear regression model it is preferable to use the
Breusch-Pagan test, as it is able to detect non-linear forms of heteroscedasticity and has
fewer parameters to estimate in the auxiliary regression, compared to the White test.
Expert Solution
This question has been solved!
Explore an expertly crafted, step-by-step solution for a thorough understanding of key concepts.

Step by step
Solved in 2 steps

Recommended textbooks for you
Trigonometry (MindTap Course List)
Trigonometry
ISBN:
9781305652224
Author:
Charles P. McKeague, Mark D. Turner
Publisher:
Cengage Learning

Glencoe Algebra 1, Student Edition, 9780079039897…
Algebra
ISBN:
9780079039897
Author:
Carter
Publisher:
McGraw Hill

College Algebra
Algebra
ISBN:
9781305115545
Author:
James Stewart, Lothar Redlin, Saleem Watson
Publisher:
Cengage Learning
Trigonometry (MindTap Course List)
Trigonometry
ISBN:
9781305652224
Author:
Charles P. McKeague, Mark D. Turner
Publisher:
Cengage Learning
Glencoe Algebra 1, Student Edition, 9780079039897…
Algebra
ISBN:
9780079039897
Author:
Carter
Publisher:
McGraw Hill
College Algebra
Algebra
ISBN:
9781305115545
Author:
James Stewart, Lothar Redlin, Saleem Watson
Publisher:
Cengage Learning

Algebra and Trigonometry (MindTap Course List)
Algebra
ISBN:
9781305071742
Author:
James Stewart, Lothar Redlin, Saleem Watson
Publisher:
Cengage Learning