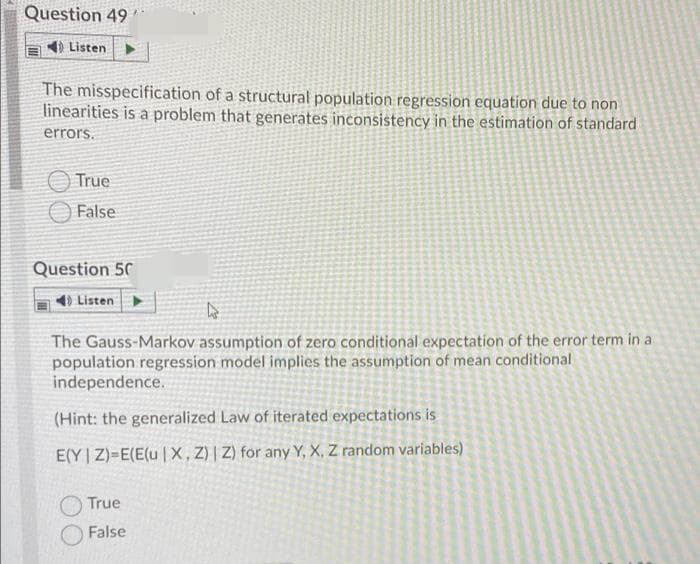
The misspecification of a structural population regression equation due to non linearities is a problem that generates inconsistency in the estimation of standard errors. True False
Q: Suppose that the 95% confidence interval for estimating a coefficient in a linear regression model…
A: Hypotheses: The null hypothesis in a linear regression analysis states that the coefficient in the…
Q: 1. Which assumption regarding the population residuals of linear regression models is necessary for…
A: According to guidelines i solve only first question if u want answer of second question send again…
Q: Is it true that Forecasts two or more periods ahead can be computed either by iterating forward a…
A: Iterated- multi-period-ahead time series forecasts are made using a one period ahead model, iterated…
Q: Calculate for the coefficient b in the linear regression equation describing the sample data
A: The equation of regression line is given by: y = a + bx Here, 'a' is the y-intercept and 'b' is the…
Q: Even though the disturbance term in the classical linear regression model is not normally…
A: Please find the explanation below. Thank you
Q: The random error term represents the influences of all of the unobserved factors that are not…
A: The general form of the regression model is as shown below: Y=β0+β1X1+β2X2+...+βkXk+U Here U…
Q: Define a general formula used for a nonlinear population regression function? Explain with example?
A:
Q: Define the ADL and GLS Estimators of Regression.
A:
Q: What two plots did we use in this chapter to decide whether we can reasonably presume that the…
A:
Q: Whenever the slope of a regression line is zero, the correlation coefficient will also be zero.…
A: We have to tell, If slope of regression equation becomes zero than correlation coefficient will also…
Q: Explain, If the population regression function changes over time, then OLS estimates neglecting this…
A: Introduction: The multiple linear regression equation of the response variable, y, on k predictor…
Q: If the error term in a linear regression model is normally distributed, then the distribution of the…
A:
Q: The standard method for estimating the parameters in a simple linear regression model is the method…
A:
Q: It is possible for none of the actual (observed) data points to be located on the regression line…
A: It is possible of course Rhe regression line can be regarded as "mean" For the set of data and,…
Q: Why Stochastic error term must be present in a regression equation?
A: Regression analysis: Regression analysis estimates the relationship among variables. That is, it…
Q: If all actual values of the dependent variable lie on the estimated regression line, then the…
A: From the given information, All the actual values of dependent variable are lie on the straight…
Q: In general, what are some problems with using regression to measure causal effects?
A: Regression is generally used to summarize data or to predict the dependent variable. Some…
Q: What are some examples of ways in which linear regression to create a beneficial statistical…
A: Linear Regression:Linear regression is a method used to establish a relationship between the…
Q: What is the difference between a population linear model and an estimated linear regression model?
A: Linear regression attempts to model the relationship between two variables by fitting a linear…
Q: Explain why we might sometimes consider explanatory variables in a regression model to be random.
A: Hint: Here we need to write why sometime we use explanatory variables.
Q: Show that an interaction term of a dummy variable and a regressor changes the slope of a regression…
A: Please find the explanation below. Thank you
Q: Can logistic regression be used in both prospective and retrospective study? Will the odds ratios of…
A: Note: Hey there! Thank you for the question. As you have posted multiple questions, we have solved…
Q: Suppose there is a significant correlation between variables. describe 2 cases under which it might…
A: 2 cases where a significant correlation between 2 variables need not make one a predictive factor…
Q: In simple linear regression, most often we perform a two-tail test of the population slope 1 to…
A: The study is about performing a two-tail test of the population slope 1 to determine whether there…
Q: In Exercises, assume that the variables under consideration satisfy the assumptions for regression…
A:
Q: The most common methods used to ‘fit’ a straight line to a dataset with a continuous outcome and…
A:
Q: Describe about the need of mathematical solution for least square regression line?
A:
Q: 3. In some data sets, there are values that are far from the linear regression line. What are the…
A: In some data sets, there are values that are far from the linear regression line. What are the data…
Q: Write down the formula of least square regression line?
A: Let a be the intercept and b be the slope.
Q: How do you determine if the y(dependent) will be less/greater than a certain value at a decided…
A: We consider the Residual of a linear regression. Residual (e) = y⏞-y˙ , where y⏞ is the…
Q: Suppose there is a significant correlation between variables. describe 2 instances in which it…
A: Given: The material of choice for the microelectronics applications includes the single crystal…
Q: Discuss the advantages of using data collected from a designed experiment in performing a regression…
A: In a designed experiment the experimenter collects the data according to their requirements.
Q: State whether the slope of a simple linear regression line is statistically significant, then the…
A: It is given that the slope of a simple linear regression line is statistically significant.
Q: Discuss the basic differences between the maximum a posteriori and maximum- likelihood estimates of…
A: What is the contrast between Maximum Likelihood (ML) and Maximum a Posteriori (MAP) assessment?As…
Q: What is the correlation coefficient of the linear least-squares regression?
A: It is given that Cov(X, Y) = -0.58 Var(X) = 7.35 and Var(Y) = 9.8
Q: 3. If the error term in a linear regression model is normally distributed, then the distribution of…
A: We have given that If the error term in a linear regression model is normally distributed then the…
Q: Illustrate the Regression Discontinuity Estimators?
A: In the context of an evaluation study, the Regression discontinuity design is characterized by a…
Q: ABC Company is exploring different prediction models that can be used to forecast indirect labor…
A: Given, machine hours Indirect labor costs 300 20000 400 24000 240 17000 370 22000 200…
Q: Explain how to determine the variance inflation factor (VIF) for a predictor variable x1 in a…
A:
Q: Why is the null hypothesis for regression usually B- 0?
A: Regression analysis: The regression analyzes the relationship between the predictor or independent…
Q: : The objective of a study is to produce a multiple regression model to explanatory variables are…
A: Multiple linear regression model: A multiple linear regression model is given as y = b0 + b1x1 +…
Q: When should a regression model not be used to make a prediction?
A: Not using regression model to make prediction when: there are few point which should be like that
Q: What effect on the results of a regression does data that exhibits heteroscedasticity cause?…
A: Here we want to regression does data that exhibit heteroscedasticity cause.
Q: True or false: “If the errors in a regression model contain ARCH, they must be serially correlated.”
A: In general, the ARCH effect test allows the occurrence of autocorrelation in the variance of error…
Q: Does correcting the sugar cane model for heteroscedasticity improve its performance? Interpret the…
A: R-squared is called regression coefficient, In first picture it is 0.48694 The sign of a regression…
Q: Assuming that all LS regression assumptions are valid and only the main effect of x1 and its two-way…
A: From the given information, It is provided that LS regression assumptions are valid and x1 and its…
Q: Suppose that x and y are two variables of a population and that the assumptions for regression…
A:
Q: Conduct an appropriate test to determine whether variable gender is statistically significant at 5%.…
A: Instruction : "i need Part E solution" Model 1 data is given below :
Step by step
Solved in 2 steps
- Question 17: A well-known brokerage firm executive claimed that 90% of investors are currently confident of meeting their investment goals. An XYZ Investor Optimism Survey, conducted over a two week period, found that in a sample of 100 people, 81% of them said they are confident of meeting their goals.Test the claim that the proportion of people who are confident is smaller than 90% at the 0.05 significance level.The null and alternative hypothesis would be: H0:p≤0.9H0:p≤0.9H1:p>0.9H1:p>0.9 H0:μ≤0.9H0:μ≤0.9H1:μ>0.9H1:μ>0.9 H0:μ≥0.9H0:μ≥0.9H1:μ<0.9H1:μ<0.9 H0:μ=0.9H0:μ=0.9H1:μ≠0.9H1:μ≠0.9 H0:p=0.9H0:p=0.9H1:p≠0.9H1:p≠0.9 H0:p≥0.9H0:p≥0.9H1:p<0.9H1:p<0.9 The test is: two-tailed right-tailed left-tailed The test statistic is: (to 3 decimals)The p-value is: (to 4 decimals)Based on this we: Fail to reject the null hypothesis Reject the null hypothesisQuestion 2 Ignore the term "maximum likelihood"Question 9 A well-known brokerage firm executive claimed that 60% of investors are currently confident of meeting their investment goals. An XYZ Investor Optimism Survey, conducted over a two week period, found that in a sample of 100 people, 61% of them said they are confident of meeting their goals.Test the claim that the proportion of people who are confident is larger than 60% at the 0.10 significance level.The null and alternative hypothesis would be: H0:μ≤0.6H0:μ≤0.6H1:μ>0.6H1:μ>0.6 H0:p≥0.6H0:p≥0.6H1:p<0.6H1:p<0.6 H0:p≤0.6H0:p≤0.6H1:p>0.6H1:p>0.6 H0:μ≥0.6H0:μ≥0.6H1:μ<0.6H1:μ<0.6 H0:μ=0.6H0:μ=0.6H1:μ≠0.6H1:μ≠0.6 H0:p=0.6H0:p=0.6H1:p≠0.6H1:p≠0.6 The test is: left-tailed right-tailed two-tailed The test statistic is: (to 2 decimals)The p-value is: (to 4 decimals)Based on this we: Fail to reject the null hypothesis Reject the null hypothesis
- Question 6 Having studied Fixed Income Securities, you are now working as an analyst for a well known bond fund. Your manager asks you to replicate the JP Morgan T-Bond Index using a tracking error minimization approach. You are to replicate this index as closely as possible using a medium duration Treasury bond (M-BOND) and a long duration Treasury bond (L-BOND). These expire in approximately 7.15 years’ and 29.25 years’ time respectively. The following variance-covariance matrix, based on daily returns over the preceding six months, is given to you to use in your replication: Note: As usual, variances are given on the diagonal, e.g. the variance of M-BOND is 0.0042%. As usual, covariances appear in the non-diagonal elements, e.g. the covariance of M-BOND and L-BOND is 0.0057%. (a) Suppose the optimal weights for M-BOND and L-BOND are 0.7 and 0.3. Calculate the expected tracking error of the portfolio and explain how you interpret this number. (b) Calculate the correlation matrix…1. What are time-series research designs, and how are they used to learn about changes in behavior over time? 2. What types of independent variables can be used in participant-variable research designs, and what conclusions can and cannot be drawn from their use? 3. What are single-participant research designs? When are they used, and what are their limitations?In Australia, 16% of the adult population is nearsighted.17 If three Australians are chosen at random, what is the probability that two are nearsighted and one is not? 2.state each of the five assumptions of the classical regression model (OLS) and give an intuitive explanation of the meaning and need for each of them.
- D & R A1 10 - 7 Question 10. Minimum Variance Commodity Hedge Choc Full of Good Inc., a producer of powdered hot chocolate, has just received a large order that will require the purchase of 800 metric tons of cocoa in 3 months. The current spot price of cocoa is US $3,055 per metric ton. The standard deviation of the change in spot cocoa price is 0.2. Mr. Dulce, the CFO of Choc Full, is considering a minimum-variance hedge of this future cocoa purchase using the three-month cocoa futures contract. The contract size is 10 metric tons. The standard deviation of the change in cocoa futures price is 0.25. The covariance between the change in the spot and futures cocoa price is 0.035. The annually compounded interest rate faced by the company is 5%, the three-month storage cost is $2.5 per metric ton, and the convenience yield is $0.5 per metric ton. What is the correlation of the change in the spot and futures cocoa price?In a simple regression analysis for a given data set, if the null hypothesis β = 0 is rejected, then the null hypothesis ρ = 0 is also rejected. This statement is ___________ true.D & R A1 10 - 3 Question 10. Minimum Variance Commodity Hedge Choc Full of Good Inc., a producer of powdered hot chocolate, has just received a large order that will require the purchase of 800 metric tons of cocoa in 3 months. The current spot price of cocoa is US $3,055 per metric ton. The standard deviation of the change in spot cocoa price is 0.2. Mr. Dulce, the CFO of Choc Full, is considering a minimum-variance hedge of this future cocoa purchase using the three-month cocoa futures contract. The contract size is 10 metric tons. The standard deviation of the change in cocoa futures price is 0.25. The covariance between the change in the spot and futures cocoa price is 0.035. The annually compounded interest rate faced by the company is 5%, the three-month storage cost is $2.5 per metric ton, and the convenience yield is $0.5 per metric ton. Compute the minimum-variance hedge ratio.
- QUESTION 12 Historically, the proportion of people who trade in their old car to a car dealer when purchasing a new car is 48%. Over the previous 6 months, in a sample of 115 new-car buyers, 46 have traded in their old car. To determine (at the 10% level of significance) whether the proportion of new-car buyers that trade in their old car has statistically significantly decreased, what can you conclude concerning the null hypothesis?Cinema HD an online movie streaming service that offers a wide variety of award-winning TV shows, movies, animes, and documentaries, would like to determine the mathematical trend of memberships in order to project future needs. Year 2013 2014 2015 2016 2017 2018 2019 2020 2021 Membership 17 16 16 21 20 20 23 25 24 Use the following time series data, to develop a regression equation relating memberships to time. Forecast 2023 membership Assuming the COVID-19 pandemic comes to an end in 2021, in your opinion, how will this affect membership? Why? How will this affect your prediction? What are the issues associated with qualitative forecasting, and how are these overcome? Provide an example of qualitative forecasting and explain the shortcomings.In the simple linear regression model , the Gauss Markov ( classical ) assumptions guarantee that the OLS estimator of the unknown parameters is BLUE. Among those assumptions , in order to have consistency of the OLS estimator we need ( this is a question on the necessary condition ): Question 4Select one: a. we need that the errors are not correlated with each others and that they have zero mean b. we need that the errors are homoscedastic ( all have the same variance) c. we need that the residuals are not correlated with the explanatory variables and that the residuals have zero mean d. we need that the errors have zero mean and that they are not correlated with the regressors ( no endogeneity) e. we need that the errors are homoscedastic ( all have the same variance) and not correlated with each others ( no serial correlation)