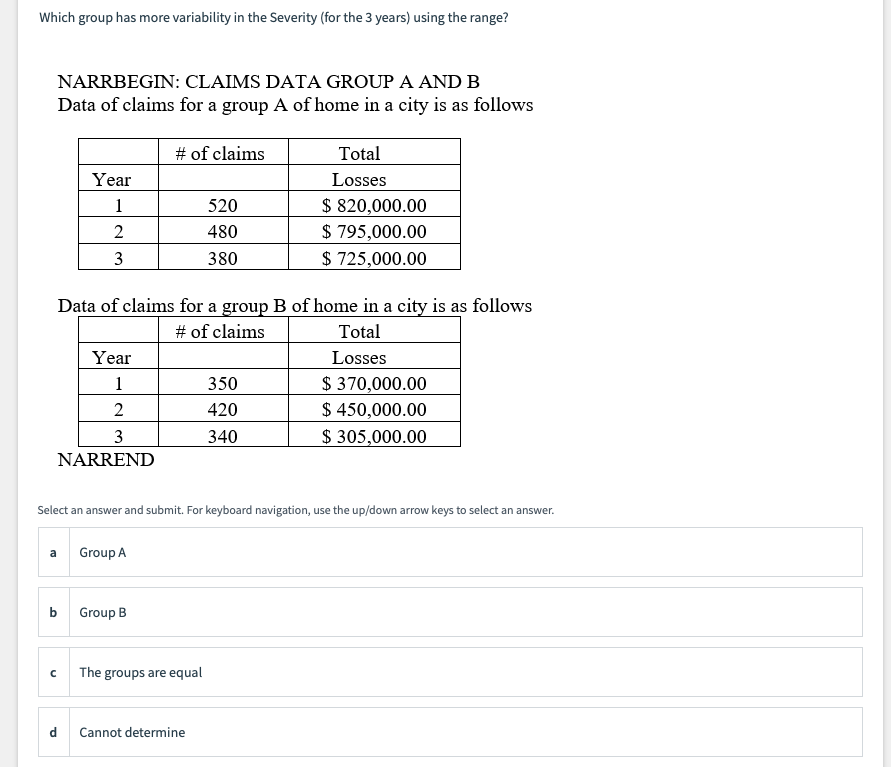
Which group has more variability in the Severity (for the 3 years) using the range?
Q: A set of data consists of 38 observations. How many classes would you recommend for the frequency…
A:
Q: Define Panel Data with Two Time Periods? can it be used for comparison?
A: Panel Data with Two Time Periods: “Before and After”: Panel data can be used to control for…
Q: The question is which box plot has the greatest variability and which box plot has the least…
A: Basics of a boxplot:A boxplot is based on the 5-number summary: (Minimum, Q1, Median, Q3, Maximum);…
Q: Calculate t for a comparison for repeated-measures data?
A: The computational procedure is to compute the difference between each pair of observations (di)…
Q: In a study, you ask the subjects their gender. Is this data qualitative or quantitative?
A: Qualitative and quantitative data:Qualitative data:Qualitative variable categories each individual…
Q: The median is the point of the _____ percentile of distribution?
A: Median is the value that divides entire distribution between two equal parts also the median is the…
Q: Find the variance of the data
A: a) given data : -3,-2,-1,0,1,2,3,4
Q: What is the mode of data? What is the range of data?
A: Given that Frequency data of time taken to complete laps in minutes. In this freq. data 5th no. of…
Q: The cost for board exam review services costs P11500, P11750, and P11250 for years 2018, 2019, and…
A: A range is an which defines the min. & max. values for any set of nos. of a particular variable.
Q: What is the formula to find weighted mean.
A: Weighted Mean: A mean in which some values are more important than others.
Q: what is the median of the data?
A: Given data 32 , 45 , 47 , 28 , 47 , 53 , 30 , 38
Q: Which of these would be considered a transformed score? a. percentile ranks and t scores b. z scores…
A: Transformed scores are those scores that have been converted from raw scores to meaningful score…
Q: Robyn Banks is an investor who acquired 100 shares of a company in year one at $10 and 50 shares of…
A: If the observations have unequal weightage then their mean value can be calculated by dividing the…
Q: The third quartile of the data: 22,17,10,35,40,18,9 is equal to
A: These are the sample data that have been provided: Observation: XX 1 22 2 17 3 10 4 35…
Q: P(Lung cancer | Smoker) is
A: The Given information shows that out of the total population 11% are smokers. as per the medical…
Q: What is the mode of the data shown below?
A: Given : We have given data of stem and leaf stem Leaf 1 1,2 2 2,3,8 3 3,4,5 4 0,0,1…
Q: Given below is the pictogram of rainfall in Kochi in 2015. Find the percentage of days when the…
A: Given:
Q: In a study, you ask the subjects their age in years. Is this data qualitative or quantitative?
A: Qualitative data:Qualitative variable categories each individual to corresponding groups. It is used…
Q: What percentage of the variation in can be explained by the corresponding variations in and taken…
A: X1 is the dependent variable X2 and X3 are the independent variables.
Q: Jesse was ranked 36th in his graduating class of 180 students. At what percentile is Jesse's…
A:
Q: A dataset contains 200 observations of y vs x where: S = 1.09 S, = 36.552
A: Hello! As you have posted more than 3 sub parts, we are answering the first 3 sub-parts. In case…
Q: Cite one significant reason why the Mode is the simplest measure of central tendency…
A: Mode is the value which is most frequently in the data. i.e. Mode is the value which has appeared…
Q: what is the independent and dependent variable in the sentence below? What is the level of…
A: Variables are any characteristics that can take on different values, such as height, age,…
Q: The relative risk of developing lung cancer among individuals who smoke is 15.0. Which of the…
A: Relative risk is the ratio of probability of an outcome in an exposed group to the probability of an…
Q: Which of the following variable is qualitative? A Number of years in school B Age of student C)…
A: Here we have to identify which of the following is qualitative variable
Q: Compare the two groups (male and female students) in terms of their measures of location and…
A: Introduction: To compare the two groups, we have first separately identified the students in the two…
Q: What steps should you follow in collecting the data of your study?
A: Data collection: In this stage, the data was collected from various sources for analysis. Here, the…
Q: Question b. Find the percentage of these adults who possess 7 or fewer credit cards. c. Draw an…
A: The frequency of the discrete or continuous can be represented in graphical format. The cumulative…
Q: In general, % of the values in a data set lie at or below the 74th percentile.
A: Solution: 74th percentile means that 74% of the data below that value and of 100–74=26% of the data…
Q: For paired observations, the value of the average difference is?
A: Detaild Explanation Given In Attached File kindly Refer.
Q: Select the excel function for the 19 percent trimmed mean of a data set in cells A1:A100. How many…
A: There are total 100 observations.
Q: Determine the skewness of the data below Frequency 1 1 2 10 6 4 5. 3. 3.
A: Given: The provided data is: X Frequency 0 1 1 5 2 10 3 6 4 3 Assuming the data is a…
Q: Q3 (d): Is the empirical relation among Mean, Median and Mode can * ?be applied for this data
A: It is given that the data follows asymmetrical skewed distribution.
Q: Which data set has the smallest variation?
A: Interquartile range: Interquartile range is used to find the difference between first and third…
Q: Enter the years into L, and the populations into L2 (in the same order). Produce a scatterplot. Does…
A: Given data:
Q: The histogram shows the distribution of hurricanes that have hit a country from 1851 through 2015,…
A:
Q: In a study with lower quartile 100, upper quartile 140 and median as 130 How many people can have…
A:
Q: The flights of stairs was measured in this study based on participants reporting the number of…
A:
Q: 2. Find the median survival.
A: Let, X be the time to failure of transplanted kidney in months. Given, X follows Weibull…
Q: MJ took a sample of 50 pieces of data. She added up all of the pieces of data and then divided by…
A: The objective is to determine which measure of central tendency is used in the given scenario.…
Q: Find the coefficient of variation using the given information median nl 3.5 4 15
A: Provided information: Median=3.5, X bar (Mean)=4 ∑(Xi-X bar)2=15, n=7 The variance of X is given…
Q: The inter-quartile range equals the 75th percentile minus the 25th perce Select one: O True O False
A: What is Inter-quartile-range(IQR)?
Q: what is the indepedent and dependent variable in the sentence below? What is the average cellphone…
A: Independent variable is the one which is manipulated or changed in a study to see its effect on…
Q: Which of the 2 predictors, Gest or Weight, is a better predictor of Height?
A: Solution:
Q: What is the dependent and independent variable in the sentence below? What is the relationship…
A: Dependent variable: is the effect. Its value depends on changes in the independent variable.…
Q: State whether the following statement is true or false: “The correlation between bushels per acre…
A:
Q: The percentile corresponding to the data value 25 is
A: Percentile is the location measure. It divide the data set into 100 equal parts with 99 points.…
Q: The mean # of hours worked
A: To find the mean number of hours worked by college students outside the home: Mean is a measure of…
Q: z = 3 is what percentile?
A:
Trending now
This is a popular solution!
Step by step
Solved in 3 steps