Which of the 2 predictors, Gest or Weight, is a better predictor of Height?

MATLAB: An Introduction with Applications
6th Edition
ISBN:9781119256830
Author:Amos Gilat
Publisher:Amos Gilat
Chapter1: Starting With Matlab
Section: Chapter Questions
Problem 1P

Related questions
Question
Which of the 2 predictors, Gest or Weight, is a better predictor of Height?
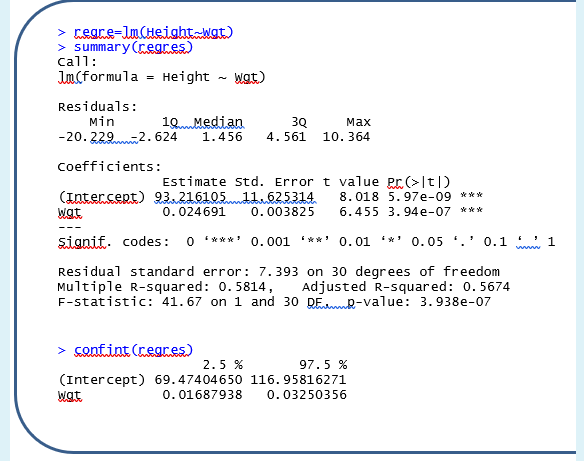
Transcribed Image Text:> cegre=lnCHeight wat)
> summary (regres)
call:
Jn(formula
Height - wat)
Residuals:
Min
-20. 229-2.624
10Median
1.456
3Q
мах
4.561
10. 364
coolm
Coefficients:
(Intercept) 93.21610511.625314
Wat
Estimate std. Error t value Pr (>|t|)
8.018 5.97e-09 ***
6.455 3.94e-07 ** *
0. 024691
0.003825
signif. codes: 0 ***** 0.001 ***' 0.01 **' 0.05 '.' 0.1 1
Residual standard error: 7.393 on 30 degrees of freedom
Multiple R-squared: 0.5814,
F-statistic: 41. 67 on 1 and 30 DER-value: 3.938e-07
Adjusted R-squared: 0. 5674
> confint (regres)
2.5 %
97.5 %
(Intercept) 69.47404650 116.95816271
wat
0. 01687938
0.03250356
Expert Solution
This question has been solved!
Explore an expertly crafted, step-by-step solution for a thorough understanding of key concepts.

Step by step
Solved in 2 steps

Recommended textbooks for you
MATLAB: An Introduction with Applications
Statistics
ISBN:
9781119256830
Author:
Amos Gilat
Publisher:
John Wiley & Sons Inc

Probability and Statistics for Engineering and th…
Statistics
ISBN:
9781305251809
Author:
Jay L. Devore
Publisher:
Cengage Learning

Statistics for The Behavioral Sciences (MindTap C…
Statistics
ISBN:
9781305504912
Author:
Frederick J Gravetter, Larry B. Wallnau
Publisher:
Cengage Learning
MATLAB: An Introduction with Applications
Statistics
ISBN:
9781119256830
Author:
Amos Gilat
Publisher:
John Wiley & Sons Inc
Probability and Statistics for Engineering and th…
Statistics
ISBN:
9781305251809
Author:
Jay L. Devore
Publisher:
Cengage Learning
Statistics for The Behavioral Sciences (MindTap C…
Statistics
ISBN:
9781305504912
Author:
Frederick J Gravetter, Larry B. Wallnau
Publisher:
Cengage Learning

Elementary Statistics: Picturing the World (7th E…
Statistics
ISBN:
9780134683416
Author:
Ron Larson, Betsy Farber
Publisher:
PEARSON

The Basic Practice of Statistics
Statistics
ISBN:
9781319042578
Author:
David S. Moore, William I. Notz, Michael A. Fligner
Publisher:
W. H. Freeman

Introduction to the Practice of Statistics
Statistics
ISBN:
9781319013387
Author:
David S. Moore, George P. McCabe, Bruce A. Craig
Publisher:
W. H. Freeman