Which of the following graphs you would recommend arosine transformation to best transform data into a normal distribution? O O O Frequency Frequency Aanbay Abundance Percentage (1) 40 35 40 30 30 25 41 40 30 25 10 35 30 10 25 20 15 SE 10 100 SE S 0 O ER2RSS 2222 - 80 910 234567 #10 X 1012 9 10 1234567 10 11 1 2 3 4 5 6 7 8 9 10 11
Which of the following graphs you would recommend arosine transformation to best transform data into a normal distribution? O O O Frequency Frequency Aanbay Abundance Percentage (1) 40 35 40 30 30 25 41 40 30 25 10 35 30 10 25 20 15 SE 10 100 SE S 0 O ER2RSS 2222 - 80 910 234567 #10 X 1012 9 10 1234567 10 11 1 2 3 4 5 6 7 8 9 10 11

Chapter5: Exponential And Logarithmic Functions
Section5.5: Exponential And Logarithmic Models
Problem 4ECP

Related questions
Question
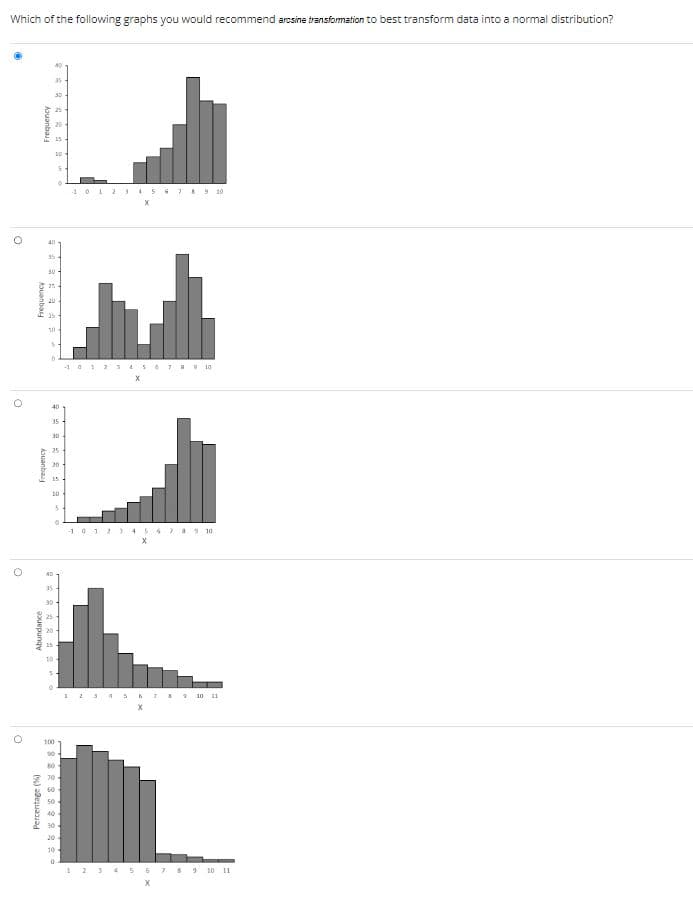
Transcribed Image Text:Which of the following graphs you would recommend arcsine transformation to best transform data into a normal distribution?
O
O
O
O
Frequency
Frequency
Aquanbay
Abundance
Percentage (%)
35
30
25
35
DD.
30
20-
35
40
35
30
25
20
·
15
100
10
30
0
0
80
70
60-
50
30
20
10-
0
10 1 2 3 4 5 6 7 8 9 10
X
2 3 4 5 6 7 10
X
10124
1 2 3 4 5 6
T
9 10
10 11
7 8 9 10 11
Expert Solution
This question has been solved!
Explore an expertly crafted, step-by-step solution for a thorough understanding of key concepts.

Step by step
Solved in 2 steps with 1 images

Recommended textbooks for you

Glencoe Algebra 1, Student Edition, 9780079039897…
Algebra
ISBN:
9780079039897
Author:
Carter
Publisher:
McGraw Hill
Glencoe Algebra 1, Student Edition, 9780079039897…
Algebra
ISBN:
9780079039897
Author:
Carter
Publisher:
McGraw Hill