Which of the following is not a robust statistic? O a. median b. None of the other choices O c interquartile range o d. mean
Q: From the following data compute Quartile Deviation : Size : 4- 7 8-10 11-13 14-16 17-19 Frequency 14…
A:
Q: use following sample home prices ($000s) to answer the questions; 175.0 48.8 995.9 298.0 218.9 209.0…
A: Hello. Since your question has multiple sub-parts, we will solve first three sub-parts for you. If…
Q: If the Stanford-Binet IQ test is a normal curve with mean of 100 and standard deviation of 20, what…
A: The population mean is 100. The population standard deviation is 20. We have to find the percent of…
Q: Answer the following statistic questions, name two different kinds of shapes that are a possibility…
A: Histogram is a graphical representation which organizes a group of data values into user-specified…
Q: Which of the following is a measure of risk? O None of the listed choices is correct O T-statistic O…
A: which one is the measure of risk 1); T statistic 2): mode 3): skewness 4): standard deviations
Q: Which of the following is the correct term for the calculation of the running average of five…
A: Running average is an average based on trials. Since it is information that we get from a number of…
Q: Which of the following descriptive statistics is least affected by outlier Select one: O a. Standard…
A: The median is the middle value of the ordered data set. Median
Q: Use the following information to answer the question. The distribution of the number of hours people…
A: Given: Population mean μ=8 Population standard deviation σ=0.5 Number of hours worked = 8.7
Q: n the following table, indicating which measures of central tendency can be paired with each measure…
A: From the given information we find the solution.
Q: Q1. Use the following set of data to calculate the followings; Wariance, mean, mode, median and the…
A: The mean is: x x−¯x¯ (x−¯x)2 11 -49 2401 22 -38 1444 33 -27 729 44 -16 256 55…
Q: If other factors are held constant, which of the following sets of data is most likely to produce a…
A:
Q: Which of the following is the best measure of dispersion for a skewed distribution? O Variance O…
A: Solution-: Which of the following is the best measure of dispersion for a skewed distribution? (a)…
Q: Which of the following is NOT a property of the Student t distribution? Select one: O a. mean is 1 O…
A:
Q: Match the following summary statistics to the type of distribution. A. Left Skewed B. Normal…
A: A left skewed- Median & IQR B- Normal- Mean & standard deviation c- Bar chart- Mode
Q: Which of the following estimators are UNBIASED? Mean Median Proportion Range…
A: These statistics are unbiased estimators as they each target the value of the corresponding…
Q: Use the following data set: 13, 8, 10, 7, 13, 9, 7, 11, 12, 10, 13 to answer questions The third…
A: From the provided information, The data values are as follow: 13, 8, 10, 7, 13, 9, 7, 11, 12, 10, 13
Q: QUESTION 25 "Which of the following options is the correct Mean Squared Within treaments value for…
A: Given SS between=759.02 SS within=717.077
Q: Consider the following sample: 10 12 14 20 31 35 40 40 55 55 57 63…
A: Solution: From the given information, the mean is 47.1250 and standard deviation is 26.1938.
Q: For the following sample of scores: 12 9. 17 2 7 The standard deviation is: Select one: 9.4 4.93 O 9…
A:
Q: As shown in the Crime Watch article of the local newspaper, 37% of the crimes in the county in the…
A: Given: As shown in the Crime Watch article of the local newspaper, 37% of the crimes in the county…
Q: Consider the following sample: 25 47 62 93 100 the mean and sample standard deviation…
A:
Q: The following sample data represent the number of paid days off taken by eight employees at a small…
A: From the provided information, Population mean (µ) = 15 Sample size (n) = 8 The mean and standard…
Q: In order to determine whether or not there is a significant diference between the bourly wages of…
A:
Q: Consider the following sample: 15 24 25 29 31 36 73 85 94 96 100 the mean…
A:
Q: Which of the following summary measures is affected most by outliers? O a the first quartile
A: Here use basic of outliers and summary relation
Q: With a mean of 40, and SEM = 5, what values would encompass 99% of scores (assume sigma is known)?
A: Introduction: Let x be the continuous random variable and it said to be follows normal distribution…
Q: Refer to the following normal curve, with mean µ and standard deviation o. The mean μ = 30 95% of…
A:
Q: 4. Compute coefficient of quartile deviation from the following data : Marks 10 20 30 40 No. of…
A:
Q: 13New July 14, 2020. Which of the following is good measure of central value for large number of…
A:
Q: For a repeat measures desing t statistic, n= 9, Md=4.90, SS=72. What is the estimate standart error…
A: Given that, n= 9, Md=4.90, SS=72 The value of standard deviation is,
Q: a. For which data set, Video 1 or Video 2, is it appropriate to use the Empirical Rule? Explain why.…
A: It is given that For video 1, mean = 52.05, SD = 12.54 For video 2, mean = 44.25, SD = 8.16 Note :…
Q: Which of the following statements involve descriptive statistics as opposed to inferential…
A: Given the four statements as a. Based on a survey of 380 magazine readers, the magazine reports that…
Q: Which of the following represents the fiftieth percentile, or the middle point in a set of numbers…
A:
Q: Which of the following is a discrete quantitative variable for a randomly selected student at your…
A: Basics:
Q: Which of the following phrases is not consistent with central tendency as a statistical measure…
A: Solution: The average score is also known as mean. The average score is the measure of central…
Q: Which of the following statements best describes the % confidence that the sample intervals in…
A: Given: The graph showing ten samples and corresponding confidence intervals.
Q: Consider the following set of data: Suppose the test statistic turned out to be z = -1.20 (not…
A: Given, z = -1.20 The objective is to find a two-tailed p-value for this test statistic.
Q: Here is some sample data that is already in a stem-and-leaf plot: 1 | 6 2 | 3 | 0 1 4 | 5 5 5 7 5 |…
A: Given: A stem and leaf plot. The observations from the stem and leaf plot are: 16, 30, 31, 45, 45,…
Q: Which of the following measures of central tendency is sensitive to extreme scores in adistribution?…
A: The outliers affect the mean of the random variable.
Q: The 3rd quartile for the dataset represented in the following boxplotis approximately what value?
A: We know that the Boxplot gives us five things of a dataset as Min_value, 1st quartile, Median,…
Q: Consider the following sample: 25 31 34 35 36 38 53 53 56 57 60 63 67…
A:
Q: Using the boxplots below, what is the operating time in hours for both iPad's such that half of all…
A: From the given box plots, The minimum time for ipad 4 is 3 and the maximum time for ipad 4 is 5.4,…
Q: Consider the following distribution : 0-10 10-20 20-30 30-40 40-50 : f 12 18 20 25 23 Compute mean,…
A: We have given that, The group data table is, X :- 0-10 10-20 20-30 30-40 40-50 f :- 12…
Q: 2) in a spot speed study for a highway section, the data were collected and shown in the table…
A: As per guidelines we will only answer first three subparts, please repost other subparts for more…
Q: Find the Quartile Deviation and its Coefficient from the following data, relating to the wéekly…
A: Given that The data are50,70,80,60,65,40,90
Q: In order to determine whether or not there is a significant difference between the hourly wages of…
A: Here GIVEN FOR COMPANY A n1=80 Sample mean=X1¯=6.75 Sample SD=S1=1 NOW FOR COMPANY B n2=60 Sample…
Q: For the following sample of n=8 scores find the meand and the standard deviation. 0,2,1,0,6,1,0,2…
A: Given data 0,2,1,0,6,1,0,2 Mean is given by
Q: 6. The following data is given: Number of animals 15 5 5 Average Domestic animals 2 Types of Animals…
A: Types of Animal n x s s2 Dogs 5 2 1 1 Cats 5 3 1.87 3.4969 Hamster 5 4 1.41 1.9881 p = 3 n…
Q: Compute coefficient of quartile deviation from the following data : Marks 10 20 30 40 50 60 No. of…
A:
Q: Consider the following sample: 10 22 63 70 98 the mean and sample standard deviation…
A: Given: Mean = μ = 52.6000 Standard deviation = σ = 36.1359.
Hi, I would appreciate if you could help me with the following questions please.
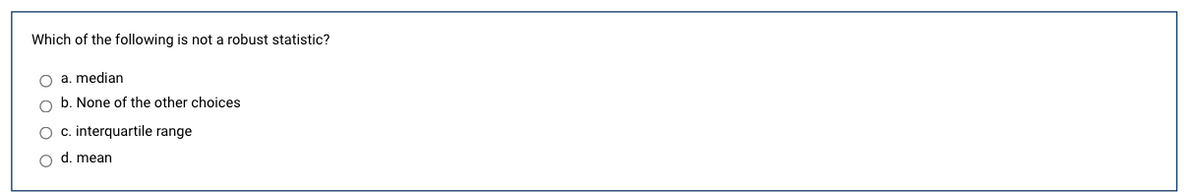
Step by step
Solved in 2 steps