Which of the following titration curves represents the results for a weak acid titrated with a strong base? pH A) see problem image A B) see problem image pH pH C) see problem image 7 В C
Which of the following titration curves represents the results for a weak acid titrated with a strong base? pH A) see problem image A B) see problem image pH pH C) see problem image 7 В C

Chapter7: Neutralization Titrations And Graphical Representations
Section: Chapter Questions
Problem 12P

Related questions

Question
100%
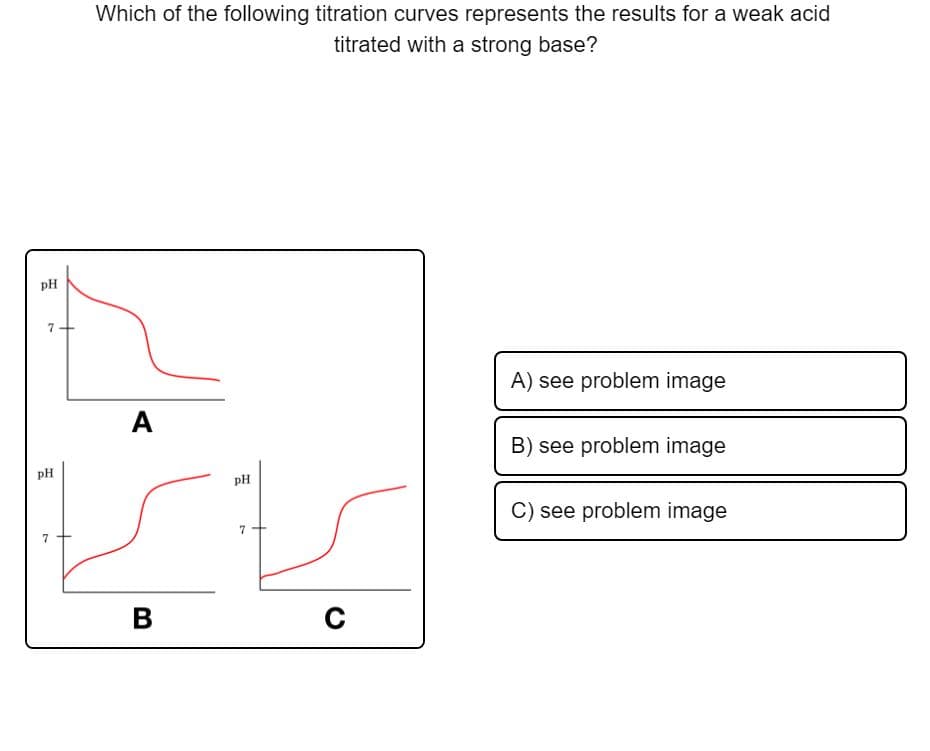
Transcribed Image Text:Which of the following titration curves represents the results for a weak acid
titrated with a strong base?
pH
7+
A) see problem image
A
B) see problem image
pH
pH
C) see problem image
7
7
В
C
Expert Solution
Step 1
After addition of base to an acid solution concentration of H+ decreases and because of that pH increases.

Trending now
This is a popular solution!

Step by step
Solved in 2 steps

Knowledge Booster


Learn more about
Need a deep-dive on the concept behind this application? Look no further. Learn more about this topic, chemistry and related others by exploring similar questions and additional content below.Recommended textbooks for you

Chemical Principles in the Laboratory
Chemistry
ISBN:
9781305264434
Author:
Emil Slowinski, Wayne C. Wolsey, Robert Rossi
Publisher:
Brooks Cole
Chemical Principles in the Laboratory
Chemistry
ISBN:
9781305264434
Author:
Emil Slowinski, Wayne C. Wolsey, Robert Rossi
Publisher:
Brooks Cole

Principles of Modern Chemistry
Chemistry
ISBN:
9781305079113
Author:
David W. Oxtoby, H. Pat Gillis, Laurie J. Butler
Publisher:
Cengage Learning

Chemistry: Principles and Practice
Chemistry
ISBN:
9780534420123
Author:
Daniel L. Reger, Scott R. Goode, David W. Ball, Edward Mercer
Publisher:
Cengage Learning

Chemistry & Chemical Reactivity
Chemistry
ISBN:
9781337399074
Author:
John C. Kotz, Paul M. Treichel, John Townsend, David Treichel
Publisher:
Cengage Learning