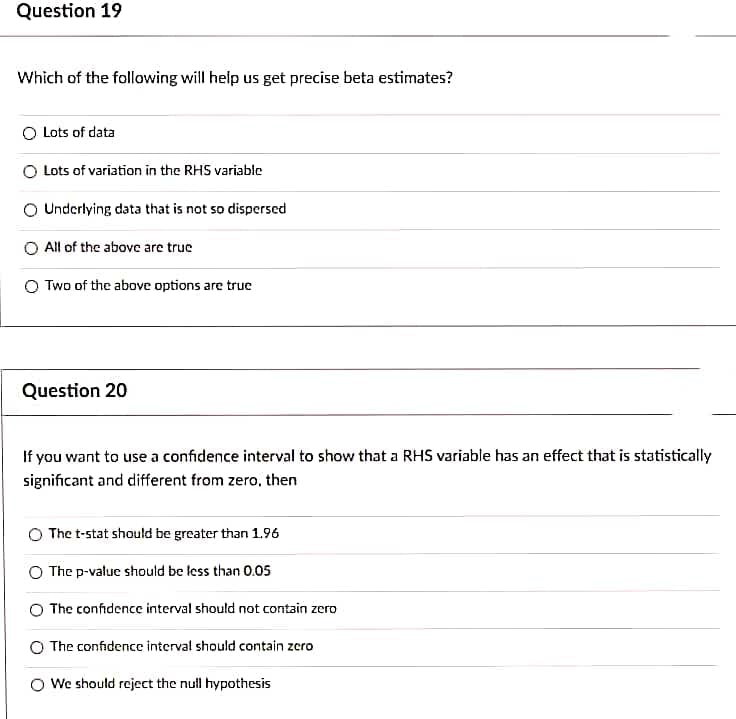
Which of the following will help us get precise beta estimates? O Lots of data O Lots of variation in the RHS variable O Underlying data that is not so dispersed O All of the above are true O Two of the above options are true


Q: I want to assess whether different types of movies increase viewers’ stress response. I recruit 24…
A: f. Between degrees of freedom is 2. Error degrees of freedom is 21 Level of significance is 0.05.…
Q: Question 5 For each of the following tobs values, determine the highest level of significance…
A: Hello ! Thank you for the question. According to our honor code can answer only three sub parts. So…
Q: 7. In this specific scenario, are the two variables of interest? Which is the IV and which is the…
A: According to the answering guidelines, we can answer only three subparts of a question and the rest…
Q: Question 4 Consider a population with mean u and variance o2 < 0. We collect an IID sample x1,...,…
A: Solution
Q: Question 4 Given Z = N(0,1) find the upper quartile of the distribution a. 0.751 b. 0.452 c. 0.674…
A: We have to find correct answer..
Q: QUESTION 6 Which of the following sets of sample data would produce the largest value for an…
A:
Q: Let there be a simple regression yt = (alpha) + (beta)x + (ε), where ε~?(0, σ^2) Let ε(hat) be an…
A: Note: Hi there! Thank you for posting the question. As you have posted multiple questions, as per…
Q: In which one of the following analyses do we find dx and dy? a. Regression b. Rank Correlation c.…
A: In regression line we find dx/dy=slope
Q: We examine the relationship between gender and fear of walking at night in their neighborhood (FEAR)…
A: Solution: Observed frequency table Afraid to walk at night Men Women Total Yes 77 175 252…
Q: consumer group claims that the mean minimum time it takes for a sedan to travel a quarter mile is…
A: As per guideline expert have to answer first three subpart only dear student please upload other…
Q: [Question 19 The common stock of DEE Bhd. has a beta of 1.24 and an actual expected return of 13.25…
A: As per CAPM ,Expected return = Risk free return + (Market return-Risk free return )*Beta…
Q: Let us revisit the hypothetical study discussed earlier in the section in which consumers are asked…
A: Given information : consumers are asked to rate a company both before and after viewing a video on…
Q: Which one of the following statements is true regarding the beta coefficient? Beta is a measure…
A: Beta coefficients is a volatile measure and used to measure sensitivity. It is also used to measure…
Q: In which one of the following analyses do we find dx and dy? O a. Karl Pearson's correlation O b.…
A: In regression line we find the value of dX/dy=slope
Q: Question 29. Calculate estimates of the standard deviations s, sy of the samples r = (5,9,7) and y =…
A: x y x2 y2 xy 5 -1 25 1 -5 9 2 81 4 18 7 5 49 25 35 ∑x=21 ∑y=6 ∑x2=155 ∑y2=30 ∑xy=48…
Q: The variance of the OLS estimator Select one: O a. increases as the number of observations increases…
A: Given problem is :
Q: Which of thr following are reasons for a unexpected sign on coefficient of an explanatory variable…
A: Correlation Coefficient: It is one of the statistical measures. It is used between any…
Q: QUESTION 8 An extensive survey in 1970 revealed preschool children spend an average of 6.3 hours per…
A: Hey there! As per our policy we can answer only 3 sub-parts at a time. Please make a new request for…
Q: Number of Fine Lines and Wrinkles Before 12 14 13 11 15 11 15 9 13 After 10 13 13 10 8 12 12 14 10 9…
A: Given : The manufacturer of a new eye cream claims that the cream reduces the appearance of fine…
Q: Consider the following competing hypotheses: Họ: Pxy = 0 HA: Pxy + 0 The sample consists of 18…
A: Given , Hypothesis : H0 : ρxy = 0 H1 : ρxy ≠ 0 Two tailed test. Sample size = n = 18 Sample…
Q: QUESTION 8 "Given the scenario below, what is the critical value? Americans typically take off 5…
A: We are authorised to answer only one question at a time, since you have mentioned many question so…
Q: The Department of Trade and Industry (DTI) conducted a survey to estimate the average number of…
A: 100(1-α)% confidence interval:
Q: Consider the following competing hypotheses: Ho: Pxy = 0 HA: Pxy * 0 The sample consists of 24…
A: Consider that ρ is the population correlation coefficient between X and Y.
Q: QUESTION 2 The state with the smallest percentage of students not meeting the minimum activity level…
A: Use the given Dotplot to construct the excel table for finding mean and standard deviation:…
Q: A sample of men and women who had passed their driver's test either the first time or the second…
A:
Q: Question 1 A car company claims that their Super Spiffy Sedan averages 31 mpg. You randomly select 8…
A:
Q: Four laboratories are being used to perform chemical analyses. Samples of the same are sent to the…
A:
Q: ********************** 27. Which of the following is (are) TRUE if the test on the linear dependence…
A: given data Which of the following is (are) TRUE if the test on the linear dependence of Y on X…
Q: answer b The following table shows the number of shirts by sizes that are manufactured in a factory…
A: The different level of measurement is given as follows- Nominal scale: It is the categorical…
Q: f. What is our critical F value (from table)? g. Fill in the ANOVA summary table with your data Sum…
A:
Q: Which of the following accurately describes the effect of increasing the alpha level? Question…
A: Correct Answer Option D Increases the risk of a Type I error and has no effect on the standard error
Q: Use the information below to answer Questions #16 - 22. The article "Probabilistic Fatigue…
A: Exponential Distribution: A continuous random variable X is said to follow Exponential distribution…
Q: Which of the following predictions is true about the CAPM. A) Beta is not the only measure…
A:
Q: The director of an alumni association wants to determine whether there is any type of relationship…
A:
Q: Which of the following is know O a. Karl Pearson's coefficien O b. Chi-Squared Product-Mc O c.…
A: product moment coefficient measures the linear relation between two variables is gives the strength…
Q: 3. If e is a point estimator of the parameter 0, with E(@) = 0, then e is a(an) ( A. biased…
A: # Point estimator of theta is thera^ such that E(theta^)=theta which means theta^ is called ??
Q: Question # 2: You are required to find the following values for the given data. 1- coefficient of…
A: 1. We know that, the coefficient of skewness is given by,…
Q: Which of the following is a correct statement? SSR=SST+SSE None of the above are correct.…
A: 1) In linear regression, SST=SSE+SSR Therefore, SSR=SST+SSE is incorrect. 2) Homoscedasticity…
Q: I am struggling in my Psyc 300 Statistic class. I seem to have missed a concept early in our class…
A: State the hypotheses That is, there is no evidence to conclude that the students’ GPAs differ from…
Q: Which of the following is consistent with what r2 represents as a measure of effect size? the…
A: The correct statement about r2 as a measure of effect size is:
Q: For each of the following three studies Identify whether the hypothesis can be tested…
A: Given data In a study of how well people can detect lying, male and female participants will try to…
Q: QUESTION 8 We wish to check that normal body temperature may be more than 98.6 degrees for a certain…
A:
Q: QUESTION 12 Which of the following suggests a strong correlation between x and y? Or-0 Or-0.2 r--0.9…
A: Here we have to choose the value of r that represent strong correlation
Q: Question 5 of 5 -/1 View Policies Show Attempt History Current Attempt in Progress Suppose that x…
A: As Beta Distribution is given by f(x) = xα-11-xβ-1B(α,β) Here given α = 2.3 and β = 1 So B(2.3,1)…
Q: the 4 categories occur the following frequencies: H.: PA = 0.4; PB = 0.1; pc = 0.3; PD 0.2 Complete…
A:
Q: Question 32 Which of the following assumptions is NOT needed for OLS estimators to be unbiased…
A: Disclaimer: Since you have asked multiple questions, we will solve the first question for you. If…
Q: Question 1 For the following scenarios provide the following: • the null and alternative…
A: Given statement: a. A meal supplement provider claims that the average difference in calories…
Q: 1) For a value of population parameter 0 equal to 2, which one of the following cases corresponds to…
A: Since you have asked multiple question, we will solve the first question for you. If you want any…
Q: Given the following time series Y;: Y; = 1.5 + Y;-1 +& (a) Examine the stationarity of Y. (b) Apply…
A:

Step by step
Solved in 2 steps

- Question 10 Political Science, Inc. (PSI) specializes in voter polls and surveys designed to keep political office seekers informed of their position in a race. Using telephone surveys, interviewers ask registered voters who they would vote for if the election were held that day. In a recent election campaign, PSI found that 220 registered voters, out of 500 contacted, favored a particular candidate. a. Develop a 95% confidence interval estimate for the proportion of the population of registered voters that favors the candidate.b. Suppose that PSI would like 99% confidence that the sample proportion is within ± .03 of the population proportion. What sample size is needed to provide the desired margin of error?Question 3 A humane society claims that less than 61% of households in a certain country own a pet. In a random sample of 500 households in that country, 285 say they own a pet. At α=0.05, is there enough evidence to support the society's claim? Complete parts (a) through (c) below. (a) Identify the claim and state H0 and Ha. (b) Identify the standardized test statistic first then use technology to find the P-value. (c) Decide whether to reject or fail to reject the null hypothesis and (d) interpret the decision in the context of the original claim.QUESTION 5. (Data file included: Yes; In Sheet: Quality): Quality Associates, Inc., a consulting firm, advises its clients about sampling and statistical procedures that can be used to control their manufacturing processes. In one particular application, a client gave Quality Associates a sample of 800 observations taken while that client’s process was operating satisfactorily. The sample standard deviation for these data was 0.21; hence, with so much data, the population standard deviation was assumed to be 0.21. Quality Associates then suggested that random samples of size 30 be taken periodically to monitor the process on an ongoing basis. By analysing the new samples, the client could 5 quickly learn whether the process was operating satisfactorily. When the process was not operating satisfactorily, corrective action could be taken to eliminate the problem. The design specification indicated that the mean for the process should be 12. Corrective actions should be taken is the mean…
- QUESTION 5. (Data file included: Yes; In Sheet: Quality): Quality Associates, Inc., a consulting firm, advises its clients about sampling and statistical procedures that can be used to control their manufacturing processes. In one particular application, a client gave Quality Associates a sample of 800 observations taken while that client’s process was operating satisfactorily. The sample standard deviation for these data was 0.21; hence, with so much data, the population standard deviation was assumed to be 0.21. Quality Associates then suggested that random samples of size 30 be taken periodically to monitor the process on an ongoing basis. By analysing the new samples, the client could 5 quickly learn whether the process was operating satisfactorily. When the process was not operating satisfactorily, corrective action could be taken to eliminate the problem. The design specification indicated that the mean for the process should be 12. Corrective actions should be taken is the mean…Question 1 For the following scenarios provide the following: the null and alternative hypotheses explain whether the hypothesis test is left-tailed, right-tailed, or two-tailed, explain how you should interpret a decision that rejects the null hypothesis, and explain how you should interpret a decision that fails to reject the null hypothesis. A Don Anderson Poll reports that on average 70% of Jamaicans believe that electricity bills are too high. Sunshine Cooperation guarantees that the mean shelf life of cornflakes is at least 750 days. Consumer Affairs has advised that the standard deviation of the fuel economies of its Honda Civics for 2016 is no more than 10.7 miles per gallon. A meal supplement provider claims that the average difference in calories between two brands is 55.QUESTION 7 All the remaining questions are based on the following scenario. Suppose that the average trip time from Oak Park to UIC on the Blue line is 28 minutes and that the standard deviation of the population is 16 minutes. We are interested to know whether the average trip time on Thursdays is shorter. We study a sample of 36 trips on Thursdays and the average is 26.5 minutes. Execute a hypothesis test at alpha= 5% that the average trip time on Thursdays is shorter (that is, that it requires a smaller number of minutes). What are Ho and Ha? Ho: mu=28; Ha: mu not = 28 Ho: mu=28; Ha: mu>28 Ho: mu<28; Ha: mu=28 Ho: mu=28; Ha: mu<28 What is the formula and value for Z (mu - x-bar)/[sigma/square root of n]; z=-1.26 (mu - x-bar)/[sigma/square root of n]; z=0.10 (x-bar - mu)/[sigma/square root of n]; z=-0.56 (x-bar - mu)/[sigma/square root of n]; z=23.627 What is the P-value? Select the closest…
- QUESTION 28 The following are body mass index (BMI) scores measured in 12 patients who are free of diabetes and are participating in a study of risk factors for obesity. Body mass index is measured as the ratio of weight in kilograms to height in meters squared. Generate a 95% confidence interval estimate of the true BMI. 25 27 31 33 26 28 38 41 24 32 35 40Question 14 Use a t-distribution to find a confidence interval for the difference in means μd=μ1-μ2 using the relevant sample results from paired data. Assume the results come from random samples from populations that are approximately normally distributed, and that differences are computed using d=x1-x2.A 99% confidence interval for μd using the paired data in the following table: Case 1 2 3 4 5 Treatment 1 22 29 32 26 29 Treatment 2 19 32 24 21 21 Give the best estimate for μd, the margin of error, and the confidence interval.Enter the exact answer for the best estimate, and round your answers for the margin of error and the confidence interval to two decimal places.best estimate = Enter your answer; best estimatemargin of error = Enter your answer; margin of errorThe 99% confidence interval is Enter your answer; The 99% confidence interval, value 1 to Enter your answer; The 99% confidence interval, value 2 .Question 17: A well-known brokerage firm executive claimed that 90% of investors are currently confident of meeting their investment goals. An XYZ Investor Optimism Survey, conducted over a two week period, found that in a sample of 100 people, 81% of them said they are confident of meeting their goals.Test the claim that the proportion of people who are confident is smaller than 90% at the 0.05 significance level.The null and alternative hypothesis would be: H0:p≤0.9H0:p≤0.9H1:p>0.9H1:p>0.9 H0:μ≤0.9H0:μ≤0.9H1:μ>0.9H1:μ>0.9 H0:μ≥0.9H0:μ≥0.9H1:μ<0.9H1:μ<0.9 H0:μ=0.9H0:μ=0.9H1:μ≠0.9H1:μ≠0.9 H0:p=0.9H0:p=0.9H1:p≠0.9H1:p≠0.9 H0:p≥0.9H0:p≥0.9H1:p<0.9H1:p<0.9 The test is: two-tailed right-tailed left-tailed The test statistic is: (to 3 decimals)The p-value is: (to 4 decimals)Based on this we: Fail to reject the null hypothesis Reject the null hypothesis
- question 25 Nationally, patients who go to the emergency room wait an average of 5 hours to be admitted into the hospital. Do patients at rural hospitals have a lower waiting time? The 10 randomly selected patients who went to the emergency room at rural hospitals waited an average of 3.8 hours to be admitted into the hospital. The standard deviation for these 10 patients was 2 hours. The p-value is <OR > α? Based on this, we should reject or fail to reject the null hypothesis.? Thus, the final conclusion is that ...(choose 1 correct answer ) The data suggest that the population mean awaiting time to be admitted into the hospital from the emergency room for patients at rural hospitals is not significantly lower than 5 hours at αα = 0.01, so there is statistically insignificant evidence to conclude that the population mean waiting time to be admitted into the hospital from the emergency room for patients at rural hospitals is lower than 5 hours. The data suggest the…QUESTION 5 PART A- Carry out a formal t-test for the association between extroversion and neuroticism in personalities. H0: The population correlation coefficient is 0. HA: The population correlation coefficient is not 0. What is the critical value of the t-statistic required to reject the null hypothesis at a confidence level of 0.05? (Report the absolute value. The t-distribution is symmetric, thus it is easier to compare the absolute value of the t-statistic with the positive values in statistical table C). QUESTION 5 PART B- The data in chocolate_nobels is not bivariate normal. Plot a scatter plot of the data. Based on the scatter plot, how does the data deviate from bivariate normality? There are outliers The standard deviation of both variables seems to increase as the variables increase. The relationship between the two variables is not linear. The standard deviation of the Nobel prize winners seems to increase as chocolate…Question 1 For the following scenarios provide the following: • the null and alternative hypotheses • explain whether the hypothesis test is left-tailed, right-tailed, or two-tailed, • explain how you should interpret a decision that rejects the null hypothesis, and • explain how you should interpret a decision that fails to reject the null hypothesis. a. A meal supplement provider claims that the average difference in calories between two brands is 55.


