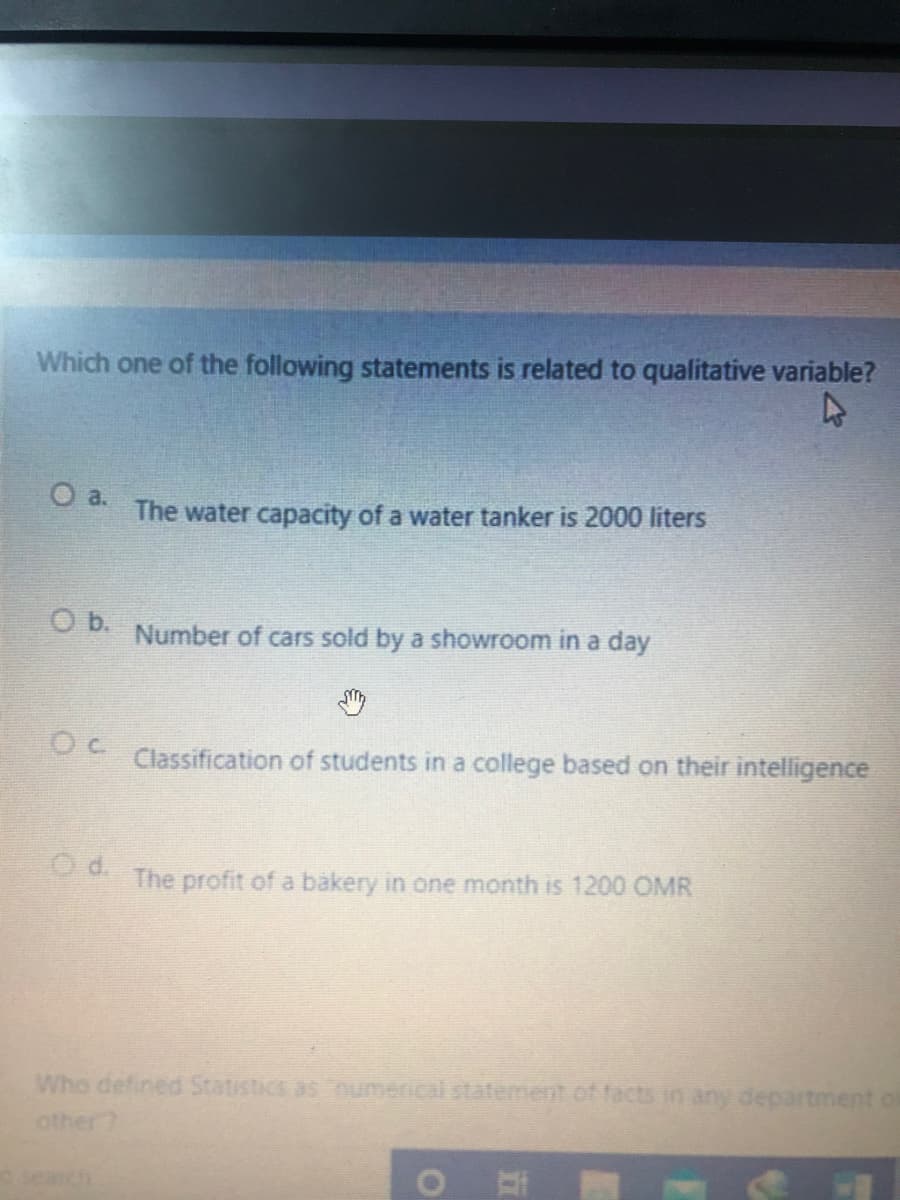
Which one of the following statements is related to qualitative variable?
Q: Which of the following statements is true regarding this data set: 41, 13, 17, 10, 5, 19? * a) The…
A:
Q: the mode for the following data: 14, 27, 6, 2, 11 ,12, 5, 5,14, 27, 7, 5
A:
Q: 1. What are the variables under study? 2. From the information given, comment on the relationship…
A: Given:
Q: Consider the quantities μ1, σ1, x1, s1, μ2, σ2, x2, and s2. a. Which quantities represent parameters…
A: a) Parameter: The statistical measure that describes the features of the population is termed as a…
Q: e) When comparing two quantitative variables when represented by a Boxplot, we select an option
A: Box plot: A categorical and continuous outcome variable data can be compared using the Box plots or…
Q: The name of your cat is an example of nominal data. True False
A: There are four types of scale(or level) for measurement, i.e., Ratio scale: data is continuous…
Q: 1. What are the two main types of variables? 2. What types of graphs you can draw for a Qualitative…
A: 1) The two main types of variables are Qualitative and Quantitative variables. A qualitative…
Q: Which of the following variable is qualitative? A IQ of chess player B Student ID Number (C) Number…
A: Quantitative data : the data that can be measured or counted and expressed in numbers. Qualitative…
Q: 2. The three data sets have the same mean and range, but is the variation the same? (a) 5, 7,9, 11,…
A: Given data sets isa)5,7,9,11,13,15,17b)5,6,7,11,15,16,17c)5,5,5511,17,17,17
Q: Briefly explain another way of collecting data other than a questionnaire. Provide an ample of the…
A: Note: Hi there! Thank you for posting the question. As you have posted multiple questions, as per…
Q: What is the difference between qualitative (categorical) data and quantitative data? Provide…
A: Qualitative data: Qualitative data is measures attribute of events. Quantitative data: Quantitative…
Q: 2. Pick out 2 variables from the dataset. List the variables and their attributes. Are the variables…
A: Variable 1: How often R attends religious services. Variable 2: Age of respondent Variables are of…
Q: II. For each of the following variables, indicate whether it is qualitative or quantitative…
A: Quantitative data: Data that can be counted or measured, and given a numerical value. Qualitative…
Q: 1. Cite three examples of two variables that are positively and three bivariate data that are…
A: To explain: To explain the variables that are positively and negatively correlated along with…
Q: The data in the accompanying table were collected from a statistics class. The first row gives the…
A: This table contains the living situation of students ,but not contains no: of hours of study per…
Q: Cite one significant reason why the Mode is the simplest measure of central tendency…
A: Mode is the value which is most frequently in the data. i.e. Mode is the value which has appeared…
Q: Indicate whether the following variables are qualitative or quantitative i) Number of minutes it…
A:
Q: Different types of graphical displays are appropriate for communicating categorical data versus…
A: Graphs are extremely useful to visually represent characteristic of a data set.
Q: what is the independent and dependent variable in the sentence below? What is the level of…
A: Variables are any characteristics that can take on different values, such as height, age,…
Q: Which of the following capability indices are a measure of actual rather than potential performance.…
A: In process improvement efforts, the process capability ratio is a statistical measure of process…
Q: using the data below, what are the conclusions of the test?
A: Based on the analysed results above, we see that the data consists of, Contrasts - 1, 2 and 3 ,…
Q: Why it is important to ensure construct validity of the variable? Refer the given table and explain…
A: Validity tells you how accurately a method measures something. If a method measures what it claims…
Q: identify the independent variable, the dependant variable and the unit of analysis of the following…
A: The statement is “Does high school mobility negatively influence perceptions of school climate?”.…
Q: Which of the following is the response variable in the study? Drug groups, children, serum alkaline…
A: Introduction: It is required to identify the response variable, and find the value of the test…
Q: Determine whether the data described are qualitative or quantitative. Styles of shoes. OQualitative…
A: We have to choose correct answer for given statement style of shoes For choose correct option…
Q: What steps should you follow in collecting the data of your study?
A: Data collection: In this stage, the data was collected from various sources for analysis. Here, the…
Q: 2. The three data sets have the same mean and range, but is the variation the same? (a) 5, 7,9,11,…
A: Given : (a) 5 7 9 11 13 15 17 (b) 5 6 7 11 15 16 17 (c) 5…
Q: Give 2 examples of Mode in Measure of central tendency to ungrouped data
A: Introduction: It is required to provide two examples of calculating the mode of ungrouped data.
Q: An extraneous variable that might affect a study of car sales versus income is O al currency…
A: The study is conducted between the two variables car sales and income.
Q: Mean of the data 14, 12, 15, 12, 17 is 14.0 13.5 14.5 O 15.0
A: To find: Mean of the data
Q: Define the term Qualitative variable with example?
A: Qualitative variable: The variables which are not numerical are called as Qualitative variables.…
Q: What type if variable is color vision status categorical or quantitative
A: Given that Qualitative variables or Categorical variables: The data which cannot be expressed as…
Q: what is mean?
A: Mean:Mean is a measure of center in case of quantitative data.
Q: Identify the independent variable, the dependent variable, and the unit of analysis in the following…
A: Here, we have to observe different families to infer , families that eat dinner together regularly…
Q: 3. Explain the differences between categorical and qualitative data. Provide examples.
A: Categorical or qualitative data are both the same thing. Both are non-numerical data. Either you say…
Q: 1. In one or two sentences describe your population. 2. What did you use for your qualitative data?…
A: Given information: Histogram for the length of item is shown.
Q: You would like to determine if there is a statistical relationship between the amount of caffein in…
A: a) In the above example number of cups of the coffee sold is the response variable and amount of…
Q: Consider the quantities µ1, σ1, x1, s1, µ2, σ2, x2, and s2. a. Which quantities represent parameters…
A: (a)Parameter:Any statistical measure based on all units in the population is called Parameter.
Q: 2. What types of graphs you can draw for a Qualitative (Categorical) variable? 3. What types of…
A: 2. The qualitative data is the descriptive and conceptual findings collected through questionnaires,…
Q: Which one of the following is the best example of ordinal data? Scores on a test of self-esteem O…
A:
Q: Suppose the observational units in a study are the patients arriving at an emergency room on a given…
A: The observational units in the study are the patients arriving at an emergency room on a given day.
Q: 3. What is the relative frequency of a customer getting information from TV or newspaper? * A chef…
A: Under 40 40 and older Total Internet 135 30 165 TV or Newspaper 45 90 135 Total 180 120 300
Q: Study the following problems and determine what is appropriate to use – descriptive or inferential…
A: We use descriptive statistics when we are summarizing or describing the data provided to us like…
Q: What is the dependent and independent variable in the sentence below? What is the relationship…
A: Dependent variable: is the effect. Its value depends on changes in the independent variable.…
Q: Which one of these characteristics differentiates an experimental study from the other forms of data…
A: The independent variable is manipulated in experimental study.
Q: The variable ( TV channel preference) is a. Quantitative variable b. Qualititativ variable c. None…
A: A variable is an attribute that describes a person, place, thing, or idea and the value of the…
Q: a. What is the level of measurement of the following variables? Explain i. Age at last birthday: ii.…
A: The level of measurements is extremely important to know.
Q: A quasi-independent variable is most similar to and consistent with which of the following terms?…
A: The quasi-independent variable can be defined as a preexisting variable that is not a true…
Q: ne purpose of a statistical quality control chart is to identify when assignable causes of variation…
A: Assignable variation is easily identifiable, with a control chart as the chart shows either a trend…
Step by step
Solved in 2 steps