Which plot should be used to summarize the distribution of quantitative data that take on a large number of unique values: A: Histogram B: Barplot? Which plot should be used to summarize the counts from different levels of a qualitative factor variable: A: Histogram B: Barplot? If we want to compare the central 50% of the values of a quantiative variable across multiple levels of a separate qualitative variable, which plot should be used: A. One boxplot for each group in the same plot B. One boxplot for each group in a different plot C. One hisotogram for each group in the same plot D. One histogram for each group in a different plot?
Which plot should be used to summarize the distribution of quantitative data that take on a large number of unique values: A: Histogram B: Barplot? Which plot should be used to summarize the counts from different levels of a qualitative factor variable: A: Histogram B: Barplot? If we want to compare the central 50% of the values of a quantiative variable across multiple levels of a separate qualitative variable, which plot should be used: A. One boxplot for each group in the same plot B. One boxplot for each group in a different plot C. One hisotogram for each group in the same plot D. One histogram for each group in a different plot?

Glencoe Algebra 1, Student Edition, 9780079039897, 0079039898, 2018
18th Edition
ISBN:9780079039897
Author:Carter
Publisher:Carter
Chapter10: Statistics
Section10.3: Measures Of Spread
Problem 1GP

Related questions
Question
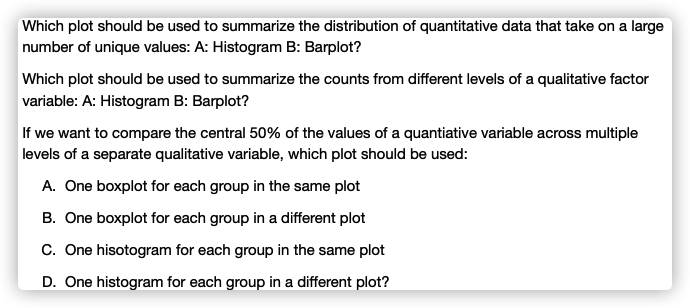
Transcribed Image Text:Which plot should be used to summarize the distribution of quantitative data that take on a large
number of unique values: A: Histogram B: Barplot?
Which plot should be used to summarize the counts from different levels of a qualitative factor
variable: A: Histogram B: Barplot?
If we want to compare the central 50% of the values of a quantiative variable across multiple
levels of a separate qualitative variable, which plot should be used:
A. One boxplot for each group in the same plot
B. One boxplot for each group in a different plot
C. One hisotogram for each group in the same plot
D. One histogram for each group in a different plot?
Expert Solution
This question has been solved!
Explore an expertly crafted, step-by-step solution for a thorough understanding of key concepts.

This is a popular solution!

Trending now
This is a popular solution!

Step by step
Solved in 2 steps with 2 images

Recommended textbooks for you
Glencoe Algebra 1, Student Edition, 9780079039897…
Algebra
ISBN:
9780079039897
Author:
Carter
Publisher:
McGraw Hill
Glencoe Algebra 1, Student Edition, 9780079039897…
Algebra
ISBN:
9780079039897
Author:
Carter
Publisher:
McGraw Hill