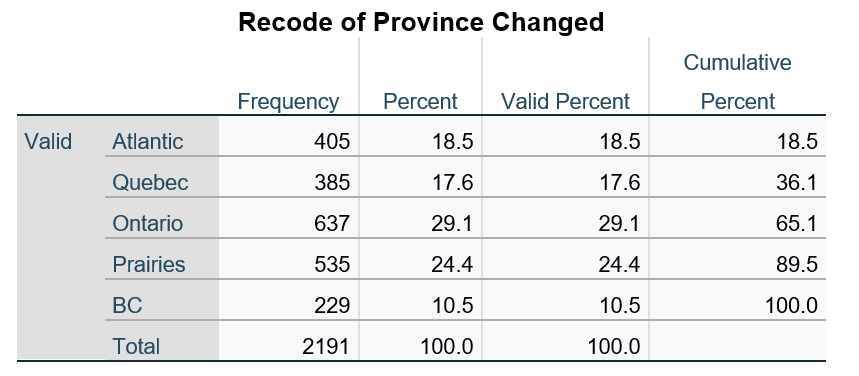
Which region has the largest population in this sample? What proportion live in that region? Which region/province has the least people? What is the percentage? How many in the sample were from the Prairies?


Q: Theorem 3.9. For two events A and B, P (AnB) = P(A) .P (B IA), P(A) > 0 = P (B) . P(A \B), P(B) >0 }...
A:
Q: 5. Let X-f(x; 0) where f(x;0) =exp{-lx-01}(-m)(x), 0 E R. Find the MLE of 6. %3D
A:
Q: You are given the following Previous question Cost= 1.5g + 20g• F. = 3.0g + 20, and da Marginal Cost...
A:
Q: r.s. 5. ! Let Let X N(µ,o²) of size n. Find an MLE for u and o?.
A: Given: x~N(μ,σ2)f(x)=1σ2πe-12x-μσ2
Q: If the arithmetic mean of the following data is 28, find the missing frequency. Then find median als...
A:
Q: Gather two sets of data and use test of difference appropriately (t-test for two sample means or pai...
A: Paired t test : The dependent sample t-test, additionally called the paired sample t-test, could be ...
Q: he population mean and standard deviation are given below. Find the required probability and determi...
A: Given: n=66 μ=22 σ=1.25.
Q: Problem II. Assume x is nomally distributed with o= 3. Use the approximate areas beneath the norn 6....
A: Note: According to Bartleby guidelines expert solve only one question and maximum 3 subpart of the f...
Q: Let X be a random sample from a population with pdf f(e|x) = ex°-1,0 0 a. Is Sn sufficient for e. b...
A: Given that X be the random variable having the pdf Then we have to find that Sn b...
Q: Problem solving on mean, mode, and median 1. Find the mean, median, and mode of the following set of...
A: Given data is 12, 8, 4, 8, 1, 8, 9, 11, 9, 10, 12, 8sample size(n)=12
Q: Length of life (hours) 1,000–1,199 The following table gives the length of life of 400 radio tubes: ...
A:
Q: A bag of 100 tulip bulbs purchased from a nursery contains 40 red tulip bulbs, 30 yellow tulip bulbs...
A: Given that the bag contain 100 bulbs. Out of this 40 are red 30 are yellow and 30 are purple. We kno...
Q: Example 4. Calculate Coefficient of Correlation from the following results : n= 10, ΣX = 100 , ΣY = ...
A:
Q: 9. Find A where P(x2 A)=0.25. 9. 10. Find A where P(xSA)=0.10. 10.
A: GivenMean(μ)=15standard deviation(σ)=3
Q: Xn be a random sample from Let X,, X2, Beta (a, B) where a is known- Show that is sufficient for a. ...
A: Given that X1, X2, . . ., Xn be a random sample from Betaα,β, where α is known.
Q: Find the equation of the regression line for the given data. Then construct a scatter plot of the da...
A: Given data is Height x 766 620 520 508 494 484 stories y 51 46 45 43 39 35
Q: - TABLE 6E.15 Additional Thickness Data for Exercise 6.35. Subgroup X1 x2 x3 x4 21 454 449 443 461 2...
A: Given TiW layer is deposited on a substrate using a sputering tool.Table 6E.14 contains layer thickn...
Q: he distribution of savings deposits Funds The number of deposit deposited (thousand HUF) books 100 1...
A: @solution::: 1) Convergence of DepositConvergence of store essential use in the banking or monetar...
Q: Describe how you would change a VLOOKUP formula to an INDEX and MATCH nested formula. For reference,...
A: Solution: If you want any changes let me know. I'm going to explain this with an example. Let's star...
Q: The numbers examined, the mean weight and the standard deviation in each group of examination and tw...
A:
Q: A random sample of 388 married couples found that 296 had two or more personality preferences in com...
A: From the provided information,
Q: Calculate the trend values by the method of least squares from the data given below and estimate the...
A: Given The data is as follows Year Sales of TV Sales (in 000) 2006 12 2007 18 2008 20 200...
Q: Please to perform in excel and show formulas. Very importante: perfom in excel (show pictures) the...
A:
Q: A psychologist claims that the mean age at which children start walking is 17 months. latif wanted t...
A: Givensample size(n)=20sample mean(x)=15standard deviation(s)=3α=0.05
Q: Suppose that a random variable X has the uniform distribution on the integer 10...20. Whats the prob...
A:
Q: If the arithmetic mean of the following data is 28, find the missing frequency. Then find median als...
A:
Q: 1. Measurements are made on a random sample of 23 components drawn from a population size of 100. As...
A: Giiven,sample size(n)=23sample mean(x¯)=67.45standard deviation(s)=2.93degrees of freedom(df)=n-1df=...
Q: Find the characteristic function of the Laplace distribution with pdf f(x) = 2 - 00 <X < o0, Hence f...
A:
Q: A department of transportation hoped that they could measure the weights of big trucks without actua...
A: A scatterplot can tell how the variables are related to each other. The formula to calculate the Pe...
Q: 5.5. a) Solve the Ornstein-Uhlenbeck equation (or Langevin equation) dXt = µXµdt + odB; where µ,0 ar...
A:
Q: From the sample data above, perform the following steps. a. Create a regression model that includes ...
A: Enter given data in R : y=c(8,8,8.3,8.5,8.8,9,9.3,9.3,9.5,9.8,10,10.3,10.5,10.8,11,11.3,11.5,11.8,12...
Q: Here are summary statistics for randomly selected weights of newborn girls: n= 229, x= 32.3 hg, s=6....
A:
Q: A bag contains 6 white, 4 red and 10 black balls. Two balls are drawn at random. Find the probabilit...
A:
Q: Bring out the fallacy, if any, in the following statements : (a) The mean of a binomial distribution...
A: Here For Binomial distribution mean=np Variance=np(1-p)
Q: Suppose the age that children learn to walk is normally distributed with mean 13 months and standard...
A:
Q: Compute the Quartile Deviation and Standard Deviation from the following data: Scores - Scores Frequ...
A:
Q: c. What is the distribution of > x? > d. If one randomly selected student is timed, find the probabi...
A: As per guidelines expert have to answer first question three subparts only here three subparts answe...
Q: The average scores in a pre-final examination scored by under graduate students in the previous year...
A: Given that Population mean=63 Sample size=70 Sample mean=68 Standard deviation =15 Then we have to...
Q: A continuous random variable X that can assume values between x = 0 and x = 4 has a density function...
A:
Q: Calculate the sample mean and variance for each treatment and then calculate the t statistic and deg...
A:
Q: In a survey of 2063 adults in a recent year, 1489 say they have made a New Year's resolution. Constr...
A: Givensample size(n)=2063x=1489p^=xn=14892063=0.722
Q: r.S a) Xn f(xla) · [la[x(1-x )]", a >o r lox)' r.S 6.) X, NCu, o?) o² is wmnknown 2 is unknown c.) X...
A:
Q: d. For the 11 people, find the probability that the average coffee consumption is between 13 and 15 ...
A:
Q: Suppose that quiz scores in a beginning statistics class have a mean of 7.9 with a standard deviatio...
A: Given that mean = 7.9 S.d = 0.5
Q: (i) If X has an exponential distribution with parameter 1, find the pdf of Y = VX . (ii) If X has a ...
A:
Q: neight of 54" with a SD = 5.7". Find each to represent infinity in calculations for this in to repre...
A:
Q: A local county has an unemployment rate of 4.3%. A random sample of 17 employable peop random from t...
A:
Q: A binomial experiment with probability of success p=0.63 and n= 10 trials is conducted. What is the ...
A:
Q: Select two variables and Indicate the scale of measurement for each variable (nominal, ordinal, or s...
A: Note: Hi there! Thank you for posting the question. As you have posted multiple questions, as per th...
Q: The observed values of a function are respectively 168, 120, 72 and 63 at /the four positions 3, 7, ...
A:
- Which region has the largest population in this sample? What proportion live in that region?
- Which region/province has the least people? What is the percentage?
- How many in the sample were from the Prairies?

Step by step
Solved in 2 steps

- Estimate the percentage of the U.S. population that reacts negatively to the Confederate flag.a. less than 10 percentb. between 10 – 25 percentc. between 25 – 50 percentd. more than 50 percent Estimate the percentage of your peers (i.e., individuals in your age generation) that believe same-sex marriage should be legal.a. less than 10 percentb. between 10 – 25 percentc. between 25 – 50 percentd. more than 50 percentA consumer-testing agency wants to evaluate the claim made by a manufacturer of discount tires. The manufacturer claims that its tires can be driven at least 35,000 miles before wearing out. To determine the average number of miles that can be obtained from the manufacturer’s tires, the agency randomly selects 60 tires from the manufacturer’s warehouse and places the tires on 15 cars driven by test drivers on a 2-mile oval track. The number of miles driven (in thousands of miles) until the tires are determined to be worn out is given in the following table. Car Miles Driven 1 25 2 27 3 35 4 42 5 28 6 37 7 40 8 31 9 29 10 33 11 30 12 26 13 31 14 28 15 30 Average 31.47 Standard 5.04 Agency would like to know if the manufacturer’s claim is false. Carryout an appropriate hypothesis test (use 1% significance level). Check any assumptions you think are relevant before doing the text.The state education commission wants to estimate the fraction of tenth grade students that have reading skills at or below the eighth grade level. Step 1 of 2: Suppose a sample of 333 tenth graders is drawn. Of the students sampled, 260 read above the eighth grade level. Using the data, estimate the proportion of tenth graders reading at or below the eighth grade level. Enter your answer as a fraction or a decimal number rounded to three decimal places. Step 2 of 2: Suppose a sample of 333 tenth graders is drawn. Of the students sampled, 260 read above the eighth grade level. Using the data, construct the 80% confidence interval for the population proportion of tenth graders reading at or below the eighth grade level. Round your answers to three decimal places.
- A company studied the number of lost-time accidents occurring at its brownsville,Texas, plant. historical records show that 6% of the employees suffered lost-time accidents last year. Management believes that a special safety program will reduce suchaccidents to 5% during the current year. In addition, it estimates that 15% of employeeswho had lost-time accidents last year will experience a lost-time accident during thecurrent year.a. What percentage of the employees will experience lost-time accidents in bothyears?A consumer testing agency wants to evaluate the claim made by a manufacturer of discount tires. The manufacturer claims that its tires can be driven at least 35,000 miles before wearing out. To determine the average number of miles that can be obtained from the manufacturer’s tires, the agency randomly selects 60 tires from the manufacturer’s warehouse and places the tires on 15 cars driven by test drivers on a 2-mile oval track. The number of miles driven (in thousands of miles) until the tires are determined to be worn out is given in the following table. Car 1 2 3 4 5 6 7 8 9 10 11 12 13 14 15 n y s Miles Driven 25 27 35 42 28 37 40 31 29 33 30 26 31 28 30 15 31.47 5.04 a. Place a 99% confidence interval on the average number of miles driven, m, prior to the tires wearing out. b. Is there significant evidence (a 5 .01) that the manufacturer’s claim is false? What is the level of significance of your test? Interpret your findings.A company's quality engineer wants to check whether the average weight of the products coming out of the packaging line does not exceed 10 grams. For this, he measured the weights of the products coming out of the line by making random selection. Measurement values respectively; 8, 11,9,11,9,7,11,10,10,9. After a while ; A press machine with a newer technology has been replaced by a press machine where product losses are frequently experienced in the packaging line. and products with the same features were weighed after being processed in this new pressing machine. After the new pressing machine, the weights of the products were measured as follows; 8,8,13,17,8,12,16,14,13,15. a) Test whether the average weight of the products currently exceeds 10 grams or not, at a = 0.05 significance level, by writing the relevant hypotheses and applying all necessary steps to make a decision. Write down the decision you made as a result of the hypothesis test and interpret your decision. b)The…
- A county clerk wants to improve voter registration. He wants to send out reminders in the mail to all citizens in the county who are eligible to vote. To determine if it will actually improve voter registration, a random sample of 1250 potential voters was taken. No reminders were sent out to a group of 625 eligible voters and of those 625, 299 registered to vote. Reminders were sent out to another group of 625 voters and of those 348 registered to vote. The county clerk claims that the proportion of people who registered was significantly greater in the group that was sent the reminders. Using a 0.10 significance level, test the claim that the proportion of registered voters is higher in the group that received the reminders. What is the decision for this test? Reject the null because the test statistic is in the critical region and the p-value is less than alpha. Fail to reject the null because the test statistic is not in the critical region and the p-value is less than…A county clerk wants to improve voter registration. He wants to send out reminders in the mail to all citizens in the county who are eligible to vote. To determine if it will actually improve voter registration, a random sample of 1250 potential voters was taken. No reminders were sent out to a group of 625 eligible voters and of those 625, 299 registered to vote. Reminders were sent out to another group of 625 voters and of those 348 registered to vote. The county clerk claims that the proportion of people who registered was significantly greater in the group that was sent the reminders. Using a 0.10 significance level, test the claim that the proportion of registered voters is higher in the group that received the reminders. What is the test statistic for this test? A county clerk wants to improve voter registration. He wants to send out reminders in the mail to all citizens in the county who are eligible to vote. To determine if it will actually improve voter registration, a…A county clerk wants to improve voter registration. He wants to send out reminders in the mail to all citizens in the county who are eligible to vote. To determine if it will actually improve voter registration, a random sample of 1250 potential voters was taken. No reminders were sent out to a group of 625 eligible voters and of those 625, 299 registered to vote. Reminders were sent out to another group of 625 voters and of those 348 registered to vote. The county clerk claims that the proportion of people who registered was significantly greater in the group that was sent the reminders. Using a 0.10 significance level, test the claim that the proportion of registered voters is higher in the group that received the reminders. What is the test statistic for this test? What is the p-value for this test? What is the critical value for this test? What is the decision for this test?
- A regional government is interested in expanding the facilities of a day care center for mentally retarded children. day care center for mentally retarded children. The expansion will increase the cost of enrolling children in the center. A sample survey is to be conducted to estimate the proportion of families with affected children who will use the expanded facilities. The families are divided between those who use the current facilities and those who do not. Some families live in the city where the center is located, and others live in the surrounding suburban and rural areas. Thus, stratified random sampling is used with people from the city where the center is located. stratified sampling is used with people in the city using the facility, people in the surrounding area using the facility, people in the city not using the facility, and people in the surrounding area not using the facility, forming strata 1, 2, 3, and 4, respectively. Approximately 90% of current users and 50% of…Suppose we observe 84 alcoholics with cirrhosis of the liver, of whom 29 have hepatomas—that is, liver-cell carcinoma. Suppose we know, based on a large sample, that the risk of hepatoma among alcoholics without cirrhosis of theliver is 24%. What is the smallest number of hepatomas that would have to be observed among the alcoholics with cirrhosis of the liver for the hepatoma experience in this group to differ from the hepatoma experience among alcoholics without cirrhosis of the liver? (Hint: Use a 5% probability of getting a result at least as extreme to denote differences betweenthe hepatoma experiences of the two groups.)Emergency switch Safety engineers must determine whether industrial workers can operate a machine’s emer-gency shutoff device. Among a group of test subjects, 66% were successful with their left hands, 82% with theirright hands, and 51% with either hand.a) What percent of these workers could not operate theswitch with either hand?b) Are success with right and left hands independentevents? Explain. c) Are success with right and left hands mutually exclu-sive? Explain.


