Which statistic combines a measure of centrality with a measure of dispersion ) The coefficient of variability The coefficient of variance O The coefficient of variation The coefficient of vacation
Which statistic combines a measure of centrality with a measure of dispersion ) The coefficient of variability The coefficient of variance O The coefficient of variation The coefficient of vacation

Glencoe Algebra 1, Student Edition, 9780079039897, 0079039898, 2018
18th Edition
ISBN:9780079039897
Author:Carter
Publisher:Carter
Chapter10: Statistics
Section: Chapter Questions
Problem 19SGR

Related questions
Question
17
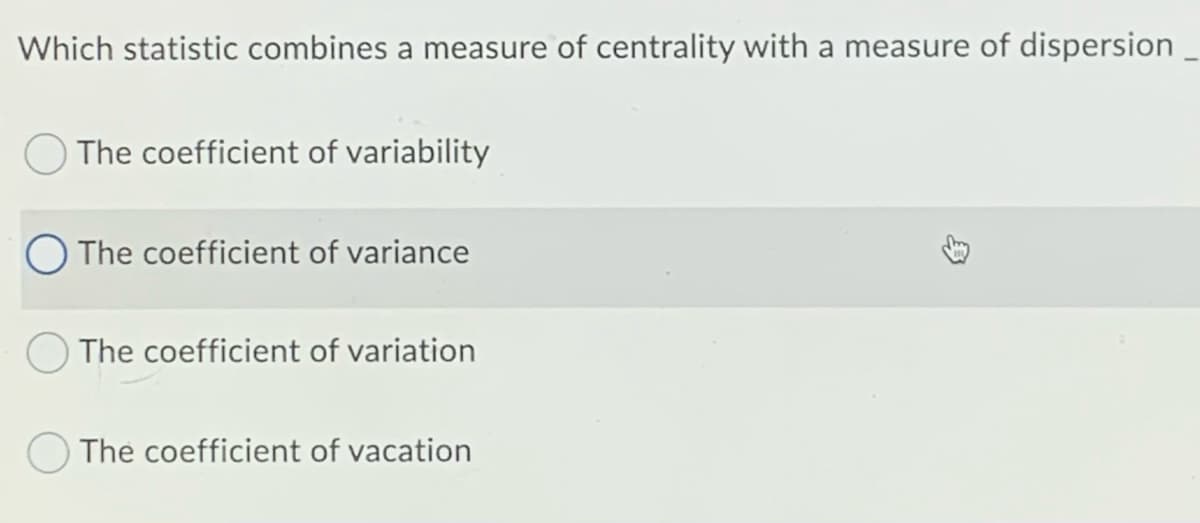
Transcribed Image Text:Which statistic combines a measure of centrality with a measure of dispersion
The coefficient of variability
O The coefficient of variance
The coefficient of variation
The coefficient of vacation
Expert Solution
Step 1
The measure of central tendency provides a measure about the center of the set of the observations.

Trending now
This is a popular solution!

Step by step
Solved in 2 steps

Recommended textbooks for you
Glencoe Algebra 1, Student Edition, 9780079039897…
Algebra
ISBN:
9780079039897
Author:
Carter
Publisher:
McGraw Hill

Big Ideas Math A Bridge To Success Algebra 1: Stu…
Algebra
ISBN:
9781680331141
Author:
HOUGHTON MIFFLIN HARCOURT
Publisher:
Houghton Mifflin Harcourt
Glencoe Algebra 1, Student Edition, 9780079039897…
Algebra
ISBN:
9780079039897
Author:
Carter
Publisher:
McGraw Hill
Big Ideas Math A Bridge To Success Algebra 1: Stu…
Algebra
ISBN:
9781680331141
Author:
HOUGHTON MIFFLIN HARCOURT
Publisher:
Houghton Mifflin Harcourt