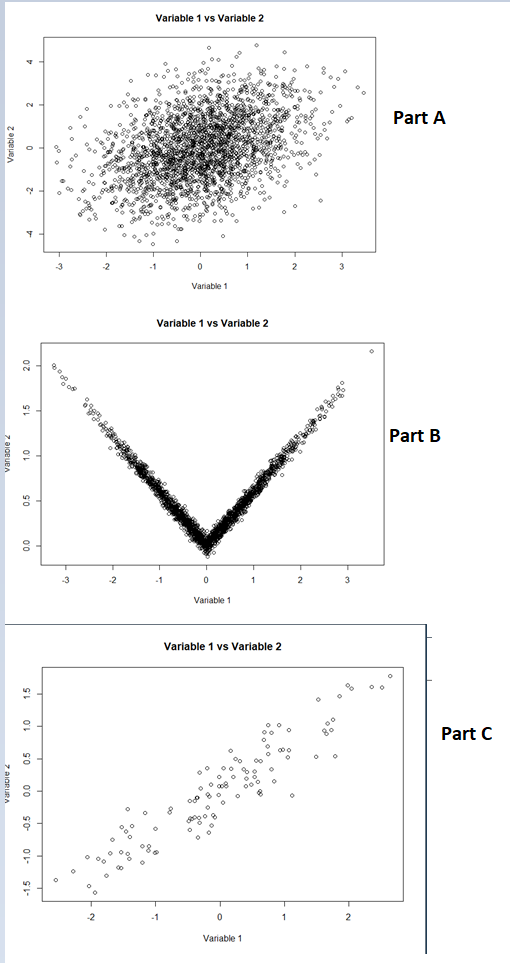
Which variable pair (in part a or b or c) has a stronger association according to the comparison of the correlations and which variable pair has a stronger association according to the comparison of the p-values? Does the comparisons according to correlation coefficients and p-values agree on which variable pair indicate the same stronger association? If not, why is there such a discrepancy? Which gene pair (in part a or b or c) has a stronger association do you think according to the scatter plots?
Which variable pair (in part a or b or c) has a stronger association according to the comparison of the correlations and which variable pair has a stronger association according to the comparison of the p-values? Does the comparisons according to correlation coefficients and p-values agree on which variable pair indicate the same stronger association? If not, why is there such a discrepancy? Which gene pair (in part a or b or c) has a stronger association do you think according to the scatter plots?

Algebra & Trigonometry with Analytic Geometry
13th Edition
ISBN:9781133382119
Author:Swokowski
Publisher:Swokowski
Chapter8: Applications Of Trigonometry
Section8.5: Trigonometric Form For Complex Numbers
Problem 4E

Related questions
Question
Which variable pair (in part a or b or c) has a stronger association according to the comparison of the
comparison of the p-values? Does the comparisons according to
agree on which variable pair indicate the same stronger association? If not, why is there such a discrepancy? Which gene pair (in part a or b or c) has a stronger association do you think according to
the scatter plots?
Part A:
- Pearson correlation of rb: 0.380875
- P-value of pb: 0.0000
- Significance level: α = 0.05
- So, there is statistically significant association at α = 0.5 between the genes.
- Also, since the p-value is less than 0.05, the null hypothesis is rejected.
- Furthermore, the magnitude and direction are that of a
positive correlation between the provided genes.
Part B:
- Pearson correlation of rb: 0.380875
- P-value of pb: 0.0000
- Significance level: α = 0.05
- So, there is statistically significant association at α = 0.5 between the genes.
- Also, since the p-value is less than 0.05, the null hypothesis is rejected.
- Furthermore, the magnitude and direction are that of a positive correlation between the provided genes.
Part C:
- Pearson correlation of rb: 0.9312196
- P-value of pb: 2.2e-16
- Significance level: α = 0.05
- So, there is significant association at α = 0.5 between the provided genes.
- Also, since the p-value is greater than 0.05, the null hypothesis is rejected.
- Furthermore, the magnitude (0.9312) and direction are that of a positive correlation between the genes.
Transcribed Image Text:Variable 1 vs Variable 2
Part A
-3
-2
Variable 1
Variable 1 vs Variable 2
Part B
-3
Variable 1
Variable 1 vs Variable 2
Part C
Variable 1
-1.5 -1.0 -0.5 0.0 0.5
0 1.5
Expert Solution
This question has been solved!
Explore an expertly crafted, step-by-step solution for a thorough understanding of key concepts.

Step by step
Solved in 2 steps

Recommended textbooks for you
Algebra & Trigonometry with Analytic Geometry
Algebra
ISBN:
9781133382119
Author:
Swokowski
Publisher:
Cengage

Functions and Change: A Modeling Approach to Coll…
Algebra
ISBN:
9781337111348
Author:
Bruce Crauder, Benny Evans, Alan Noell
Publisher:
Cengage Learning
Algebra & Trigonometry with Analytic Geometry
Algebra
ISBN:
9781133382119
Author:
Swokowski
Publisher:
Cengage
Functions and Change: A Modeling Approach to Coll…
Algebra
ISBN:
9781337111348
Author:
Bruce Crauder, Benny Evans, Alan Noell
Publisher:
Cengage Learning