Obtain the value of skewness of the variable landfill and the value of kurtosis of the variable acid. Interpret each result.
Obtain the value of skewness of the variable landfill and the value of kurtosis of the variable acid. Interpret each result.

MATLAB: An Introduction with Applications
6th Edition
ISBN:9781119256830
Author:Amos Gilat
Publisher:Amos Gilat
Chapter1: Starting With Matlab
Section: Chapter Questions
Problem 1P

Related questions
Question
Obtain the value of skewness of the variable landfill and the value of kurtosis of the variable acid. Interpret each result.
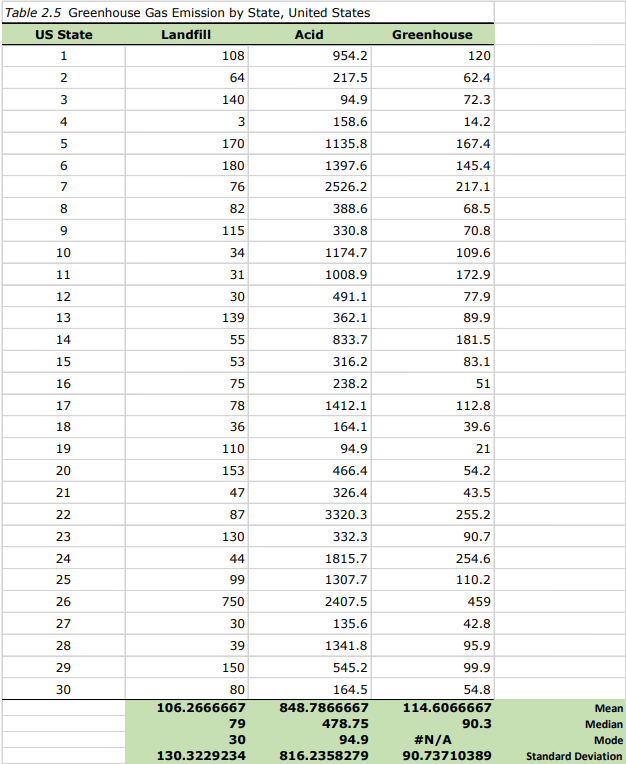
Transcribed Image Text:Table 2.5 Greenhouse Gas Emission by State, United States
US State
Landfill
Acid
1
2
3
4
5
6
7
8
9
10
11
12
13
14
15
16
17
18
19
20
21
22
23
24
25
26
27
28
29
30
108
64
140
3
170
180
76
82
115
34
31
30
139
55
53
75
78
36
110
153
47
87
130
44
99
750
30
39
150
80
106.2666667
79
30
130.3229234
954.2
217.5
94.9
158.6
1135.8
1397.6
2526.2
388.6
330.8
1174.7
1008.9
491.1
362.1
833.7
316.2
238.2
1412.1
164.1
94.9
466.4
326.4
3320.3
332.3
1815.7
1307.7
2407.5
135.6
1341.8
545.2
164.5
848.7866667
478.75
94.9
816.2358279
Greenhouse
120
62.4
72.3
14.2
167.4
145.4
217.1
68.5
70.8
109.6
172.9
77.9
89.9
181.5
83.1
51
112.8
39.6
21
54.2
43.5
255.2
90.7
254.6
110.2
459
42.8
95.9
99.9
54.8
114.6066667
90.3
#N/A
90.73710389
Mean
Median
Mode
Standard Deviation
Expert Solution
This question has been solved!
Explore an expertly crafted, step-by-step solution for a thorough understanding of key concepts.

Step by step
Solved in 2 steps

Recommended textbooks for you
MATLAB: An Introduction with Applications
Statistics
ISBN:
9781119256830
Author:
Amos Gilat
Publisher:
John Wiley & Sons Inc

Probability and Statistics for Engineering and th…
Statistics
ISBN:
9781305251809
Author:
Jay L. Devore
Publisher:
Cengage Learning

Statistics for The Behavioral Sciences (MindTap C…
Statistics
ISBN:
9781305504912
Author:
Frederick J Gravetter, Larry B. Wallnau
Publisher:
Cengage Learning
MATLAB: An Introduction with Applications
Statistics
ISBN:
9781119256830
Author:
Amos Gilat
Publisher:
John Wiley & Sons Inc
Probability and Statistics for Engineering and th…
Statistics
ISBN:
9781305251809
Author:
Jay L. Devore
Publisher:
Cengage Learning
Statistics for The Behavioral Sciences (MindTap C…
Statistics
ISBN:
9781305504912
Author:
Frederick J Gravetter, Larry B. Wallnau
Publisher:
Cengage Learning

Elementary Statistics: Picturing the World (7th E…
Statistics
ISBN:
9780134683416
Author:
Ron Larson, Betsy Farber
Publisher:
PEARSON

The Basic Practice of Statistics
Statistics
ISBN:
9781319042578
Author:
David S. Moore, William I. Notz, Michael A. Fligner
Publisher:
W. H. Freeman

Introduction to the Practice of Statistics
Statistics
ISBN:
9781319013387
Author:
David S. Moore, George P. McCabe, Bruce A. Craig
Publisher:
W. H. Freeman