While browsing through a magazine rack at a bookstore, a statistician decides to examine the relationship between the price of a magazine and the percentage of the magazine space that contains advertisements. The data are given in the following table. Percentage 37 43 58 49 70 28 65 32 containing ads Price ($) 5.50 6.95 4.95 5.75 3.95 8.25 5.50 6.75 a. Construct a scatter diagram for these data. Does the scatter diagram exhibit a linear relationship between the percentage of a magazine's space containing ads and the price of the magazine? O Yes. O No. b. Find the estimated regression equation of price on the percentage of space containing ads. Round your answers to four decimal places. i + (
While browsing through a magazine rack at a bookstore, a statistician decides to examine the relationship between the price of a magazine and the percentage of the magazine space that contains advertisements. The data are given in the following table. Percentage 37 43 58 49 70 28 65 32 containing ads Price ($) 5.50 6.95 4.95 5.75 3.95 8.25 5.50 6.75 a. Construct a scatter diagram for these data. Does the scatter diagram exhibit a linear relationship between the percentage of a magazine's space containing ads and the price of the magazine? O Yes. O No. b. Find the estimated regression equation of price on the percentage of space containing ads. Round your answers to four decimal places. i + (

Glencoe Algebra 1, Student Edition, 9780079039897, 0079039898, 2018
18th Edition
ISBN:9780079039897
Author:Carter
Publisher:Carter
Chapter4: Equations Of Linear Functions
Section4.5: Correlation And Causation
Problem 2CYU

Related questions
Question
E.) Predict the price of a magazine with 45% of its space containing ads.
F.) Estimate the price of a magazine with 99% of its space containing ads.
Why should we have little confidence in this estimate?
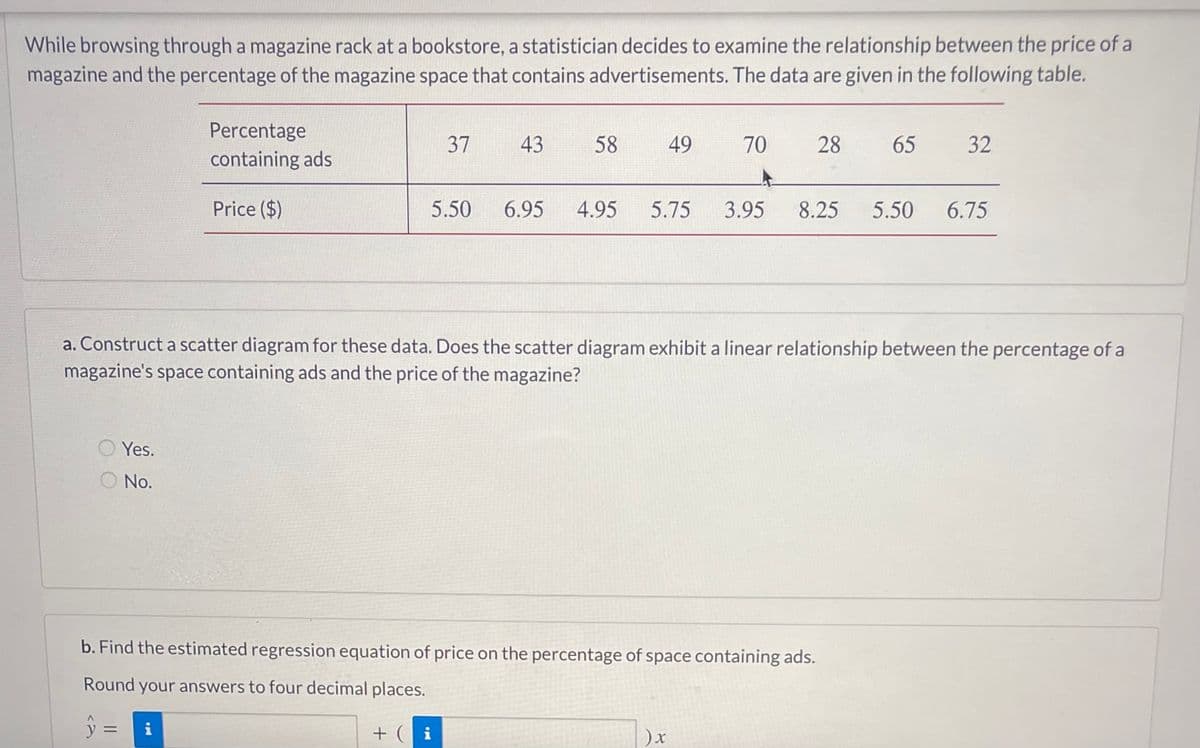
Transcribed Image Text:While browsing through a magazine rack at a bookstore, a statistician decides to examine the relationship between the price of a
magazine and the percentage of the magazine space that contains advertisements. The data are given in the following table.
Percentage
37
43
58
49
70
28
65
32
containing ads
Price ($)
5.50
6.95
4.95
5.75
3.95
8.25
5.50
6.75
a. Construct a scatter diagram for these data. Does the scatter diagram exhibit a linear relationship between the percentage of a
magazine's space containing ads and the price of the magazine?
Yes.
No.
b. Find the estimated regression equation of price on the percentage of space containing ads.
Round your answers to four decimal places.
y =
i
+ ( i
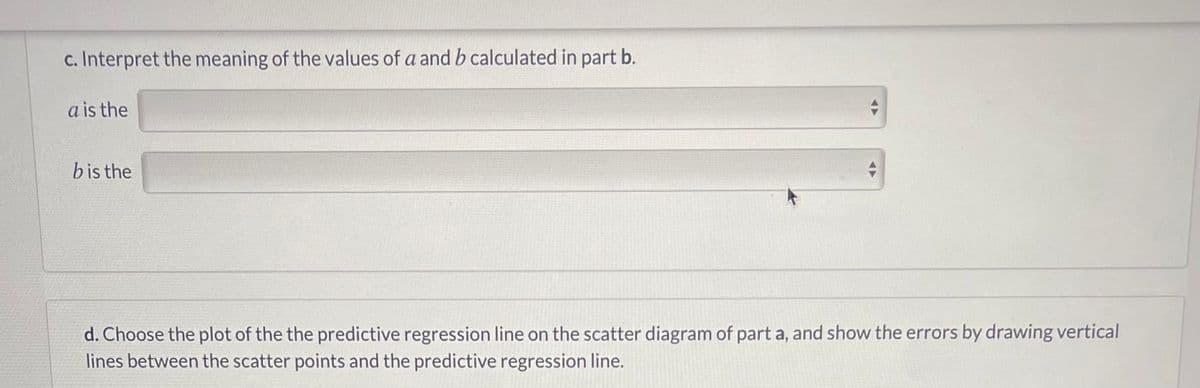
Transcribed Image Text:c. Interpret the meaning of the values of a and b calculated in part b.
a is the
bis the
d. Choose the plot of the the predictive regression line on the scatter diagram of part a, and show the errors by drawing vertical
lines between the scatter points and the predictive regression line.
Expert Solution
This question has been solved!
Explore an expertly crafted, step-by-step solution for a thorough understanding of key concepts.

This is a popular solution!

Trending now
This is a popular solution!

Step by step
Solved in 4 steps with 2 images

Recommended textbooks for you
Glencoe Algebra 1, Student Edition, 9780079039897…
Algebra
ISBN:
9780079039897
Author:
Carter
Publisher:
McGraw Hill
Glencoe Algebra 1, Student Edition, 9780079039897…
Algebra
ISBN:
9780079039897
Author:
Carter
Publisher:
McGraw Hill