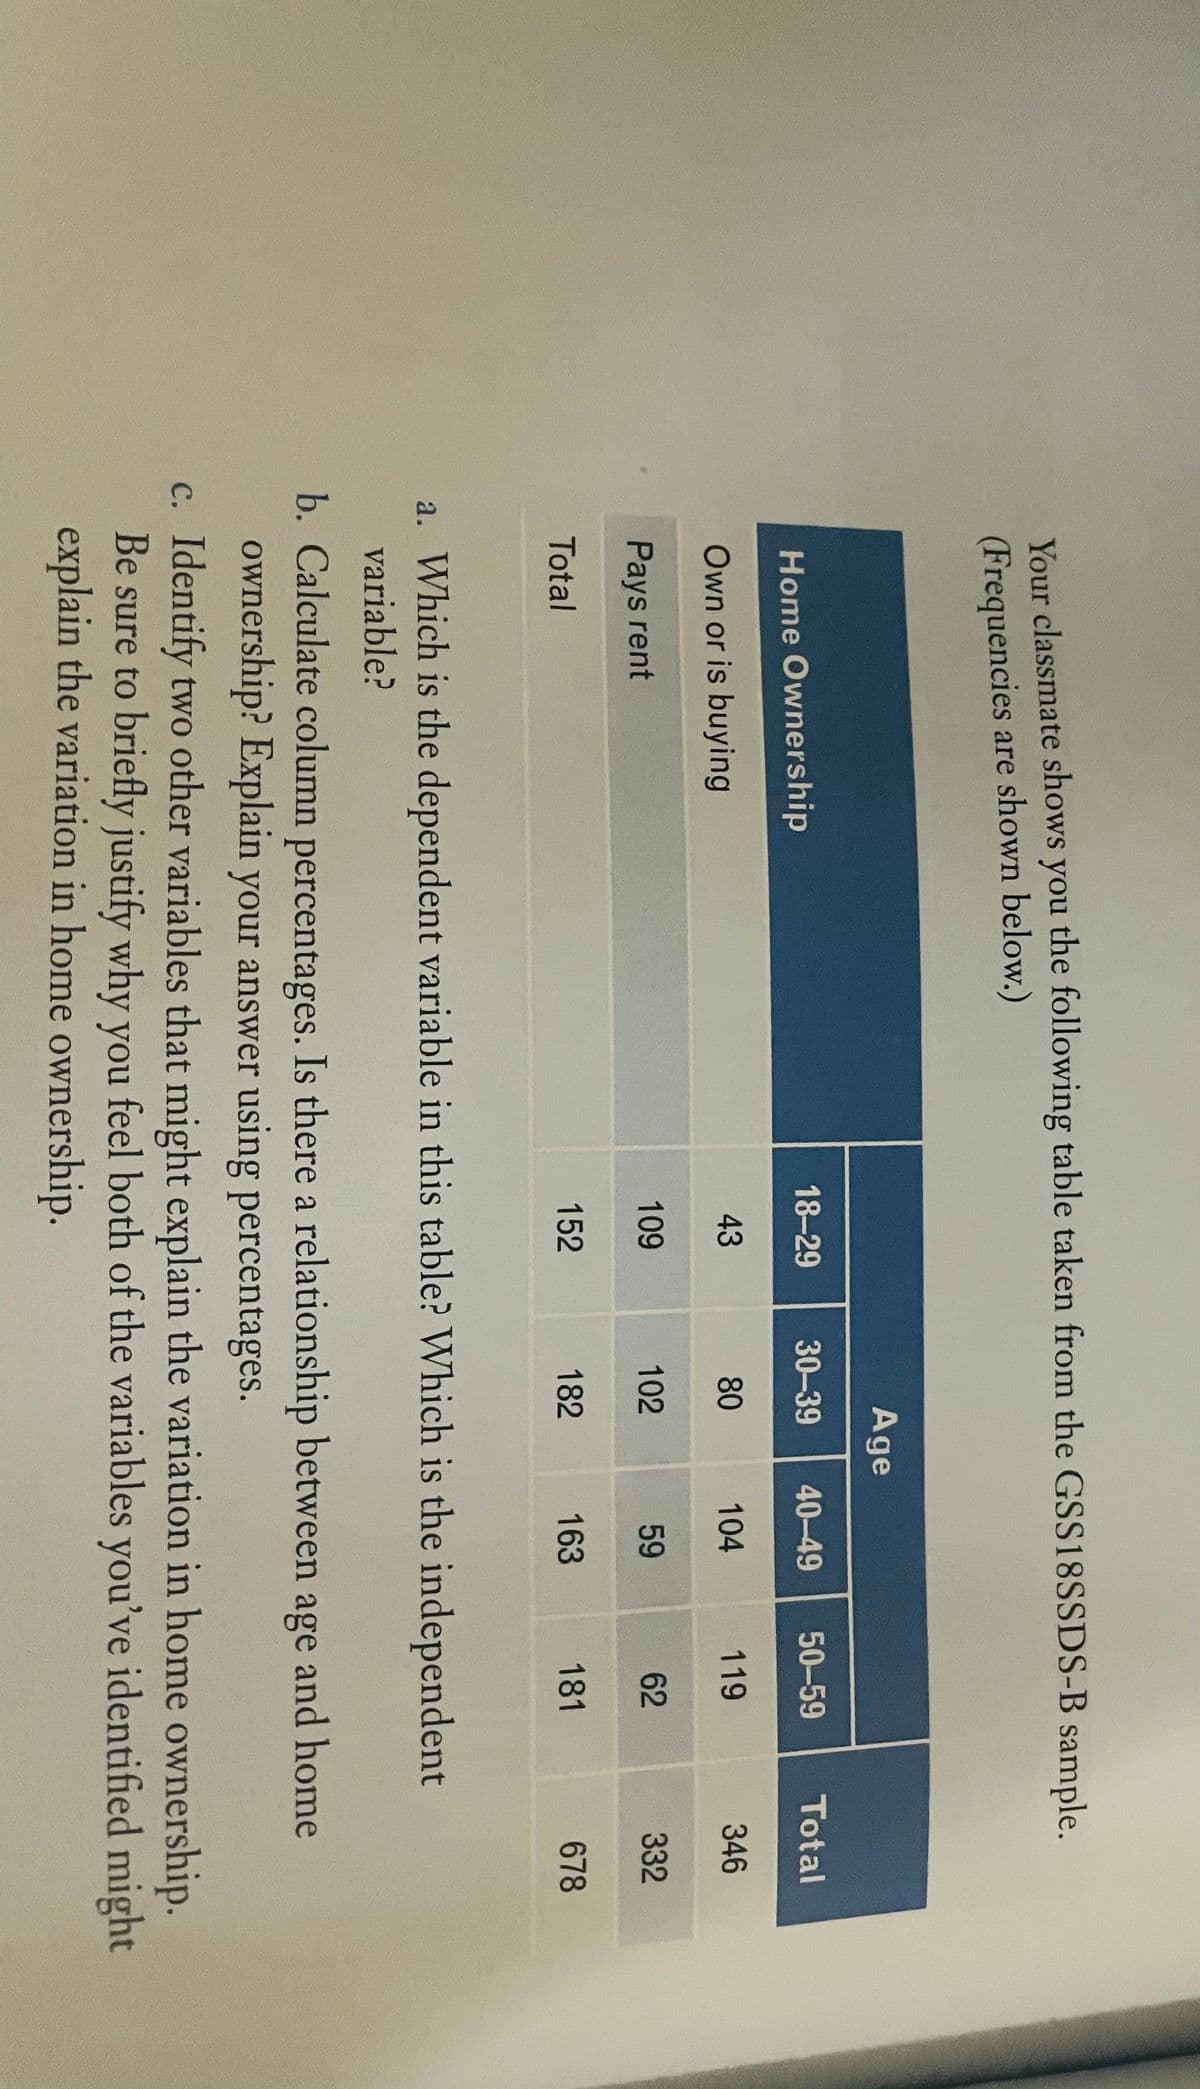
Your classmate shows you the following table taken from the GSS18SSDS-B sample. (Frequencies are shown below.) Age 18-29 30-39 40-49 50-59 Total Home Ownership Own or is buying 43 80 104 119 346 Pays rent 109 102 59 62 332 Total 152 182 163 181 678 a. Which is the dependent variable in this table? Which is the independent variable? b. Calculate column percentages. Is there a relationship between age and home ownership? Explain your answer using percentages. c. Identify two other variables that might explain the variation in home ownership. Be sure to briefly justify why you feel both of the variables you've identified might explain the variation in home ownership.
Your classmate shows you the following table taken from the GSS18SSDS-B sample. (Frequencies are shown below.) Age 18-29 30-39 40-49 50-59 Total Home Ownership Own or is buying 43 80 104 119 346 Pays rent 109 102 59 62 332 Total 152 182 163 181 678 a. Which is the dependent variable in this table? Which is the independent variable? b. Calculate column percentages. Is there a relationship between age and home ownership? Explain your answer using percentages. c. Identify two other variables that might explain the variation in home ownership. Be sure to briefly justify why you feel both of the variables you've identified might explain the variation in home ownership.

Glencoe Algebra 1, Student Edition, 9780079039897, 0079039898, 2018
18th Edition
ISBN:9780079039897
Author:Carter
Publisher:Carter
Chapter4: Equations Of Linear Functions
Section4.5: Correlation And Causation
Problem 22PFA

Related questions

Question
Transcribed Image Text:Your classmate shows you the following table taken from the GSS18SSDS-B sample.
(Frequencies are shown below.)
Age
18-29
30-39
40-49
50-59
Total
Home Ownership
Own or is buying
43
80
104
119
346
Pays rent
109
102
59
62
332
Total
152
182
163
181
678
a. Which is the dependent variable in this table? Which is the independent
variable?
b. Calculate column percentages. Is there a relationship between age and home
ownership? Explain your answer using percentages.
c. Identify two other variables that might explain the variation in home ownership.
Be sure to briefly justify why you feel both of the variables you've identified might
explain the variation in home ownership.
Transcribed Image Text:C4. We continue our examination of attitudes regarding home ownership. Suppose that
a classmate of yours suggests that home ownership can be explained by age.
Expert Solution
This question has been solved!
Explore an expertly crafted, step-by-step solution for a thorough understanding of key concepts.

This is a popular solution!

Trending now
This is a popular solution!

Step by step
Solved in 4 steps

Knowledge Booster


Learn more about
Need a deep-dive on the concept behind this application? Look no further. Learn more about this topic, statistics and related others by exploring similar questions and additional content below.Recommended textbooks for you
Glencoe Algebra 1, Student Edition, 9780079039897…
Algebra
ISBN:
9780079039897
Author:
Carter
Publisher:
McGraw Hill

Big Ideas Math A Bridge To Success Algebra 1: Stu…
Algebra
ISBN:
9781680331141
Author:
HOUGHTON MIFFLIN HARCOURT
Publisher:
Houghton Mifflin Harcourt

Functions and Change: A Modeling Approach to Coll…
Algebra
ISBN:
9781337111348
Author:
Bruce Crauder, Benny Evans, Alan Noell
Publisher:
Cengage Learning
Glencoe Algebra 1, Student Edition, 9780079039897…
Algebra
ISBN:
9780079039897
Author:
Carter
Publisher:
McGraw Hill
Big Ideas Math A Bridge To Success Algebra 1: Stu…
Algebra
ISBN:
9781680331141
Author:
HOUGHTON MIFFLIN HARCOURT
Publisher:
Houghton Mifflin Harcourt
Functions and Change: A Modeling Approach to Coll…
Algebra
ISBN:
9781337111348
Author:
Bruce Crauder, Benny Evans, Alan Noell
Publisher:
Cengage Learning