Wing graph, use the green point (triangle symbol) to plot the annual total revenue when the market price is $30, $45, $60, $75, $90, and $120 per bike. 730 620 510 1400 1290 1180 1070 960 850 740 0 15 30 45 75 90 105 120 135 150 165 60 PRICE (Dollars per bike) 180 Total Revenue ording to the midpoint method, the price elasticity of demand between points A and B is approximately in total revenue per day. ppose the price of bikes is currently $45 per bike, shown as point B on the initial graph. Because the demand between points A and B is is will lead to
Wing graph, use the green point (triangle symbol) to plot the annual total revenue when the market price is $30, $45, $60, $75, $90, and $120 per bike. 730 620 510 1400 1290 1180 1070 960 850 740 0 15 30 45 75 90 105 120 135 150 165 60 PRICE (Dollars per bike) 180 Total Revenue ording to the midpoint method, the price elasticity of demand between points A and B is approximately in total revenue per day. ppose the price of bikes is currently $45 per bike, shown as point B on the initial graph. Because the demand between points A and B is is will lead to

Microeconomics: Private and Public Choice (MindTap Course List)
16th Edition
ISBN:9781305506893
Author:James D. Gwartney, Richard L. Stroup, Russell S. Sobel, David A. Macpherson
Publisher:James D. Gwartney, Richard L. Stroup, Russell S. Sobel, David A. Macpherson
Chapter7: Consumer Choice And Elasticity
Section: Chapter Questions
Problem 13CQ: Suppose Erin, the owner-manager of a local hotel projects the following demand for her rooms: a....

Related questions
Question
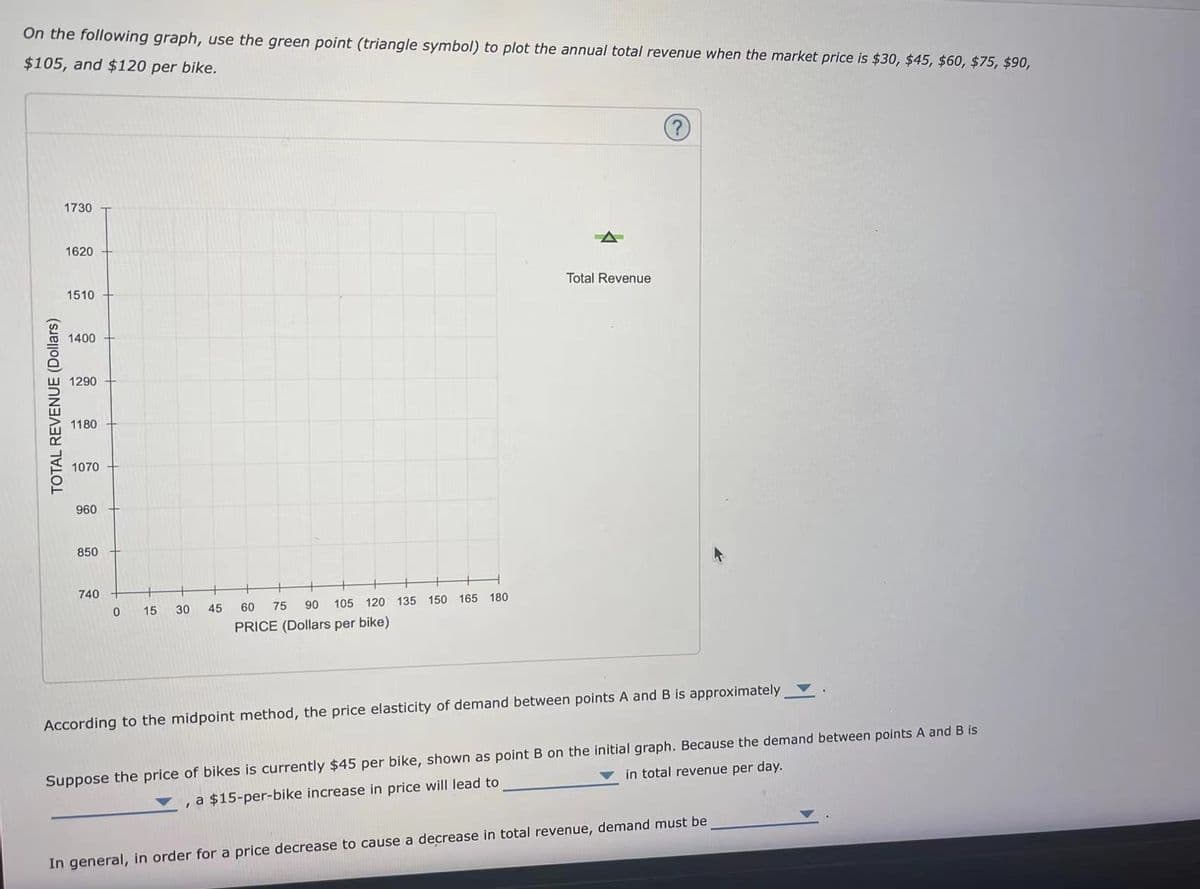
Transcribed Image Text:On the following graph, use the green point (triangle symbol) to plot the annual total revenue when the market price is $30, $45, $60, $75, $90,
$105, and $120 per bike.
TOTAL REVENUE (Dollars)
1730
1620
1510
1400
1290
1180
1070
960
850
740
0
15
30
45
105 120 135 150 165 180
60
75 90
PRICE (Dollars per bike)
Total Revenue
?
According to the midpoint method, the price elasticity of demand between points A and B is approximately
in total revenue per day.
Suppose the price of bikes is currently $45 per bike, shown as point B on the initial graph. Because the demand between points A and B is
, a $15-per-bike increase in price will lead to
In general, in order for a price decrease to cause a decrease in total revenue, demand must be
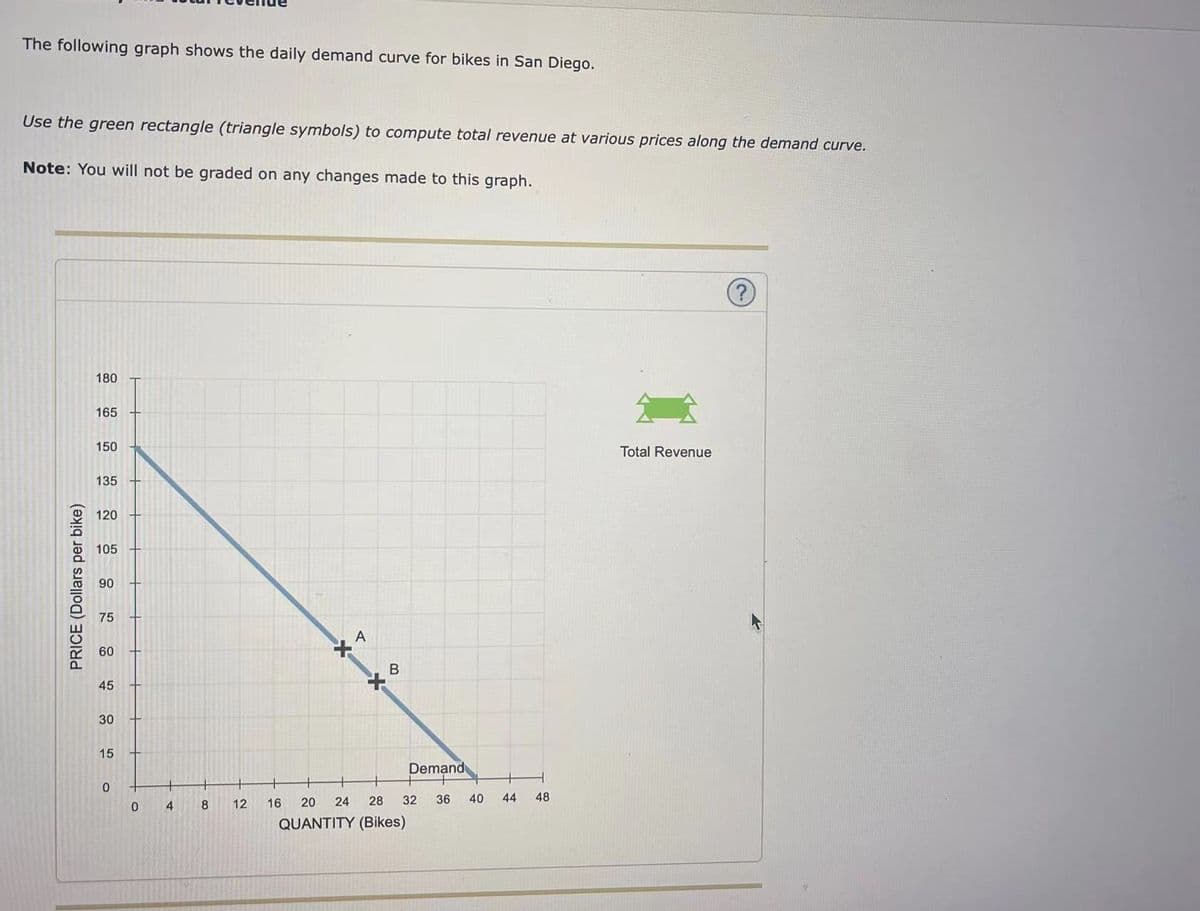
Transcribed Image Text:The following graph shows the daily demand curve for bikes in San Diego.
Use the green rectangle (triangle symbols) to compute total revenue at various prices along the demand curve.
Note: You will not be graded on any changes made to this graph.
PRICE (Dollars per bike)
180
165
150
135
120
105
90
75
60
45
30
15
0
0
4
8
12
*
16
A
*
B
20 24 28
QUANTITY (Bikes)
Demand
32
36
40
44 48
Total Revenue
?
Expert Solution
This question has been solved!
Explore an expertly crafted, step-by-step solution for a thorough understanding of key concepts.

This is a popular solution!

Trending now
This is a popular solution!

Step by step
Solved in 3 steps with 1 images

Knowledge Booster


Learn more about
Need a deep-dive on the concept behind this application? Look no further. Learn more about this topic, economics and related others by exploring similar questions and additional content below.Recommended textbooks for you
Microeconomics: Private and Public Choice (MindTa…
Economics
ISBN:
9781305506893
Author:
James D. Gwartney, Richard L. Stroup, Russell S. Sobel, David A. Macpherson
Publisher:
Cengage Learning

Economics: Private and Public Choice (MindTap Cou…
Economics
ISBN:
9781305506725
Author:
James D. Gwartney, Richard L. Stroup, Russell S. Sobel, David A. Macpherson
Publisher:
Cengage Learning

Exploring Economics
Economics
ISBN:
9781544336329
Author:
Robert L. Sexton
Publisher:
SAGE Publications, Inc
Microeconomics: Private and Public Choice (MindTa…
Economics
ISBN:
9781305506893
Author:
James D. Gwartney, Richard L. Stroup, Russell S. Sobel, David A. Macpherson
Publisher:
Cengage Learning
Economics: Private and Public Choice (MindTap Cou…
Economics
ISBN:
9781305506725
Author:
James D. Gwartney, Richard L. Stroup, Russell S. Sobel, David A. Macpherson
Publisher:
Cengage Learning
Exploring Economics
Economics
ISBN:
9781544336329
Author:
Robert L. Sexton
Publisher:
SAGE Publications, Inc


Economics (MindTap Course List)
Economics
ISBN:
9781337617383
Author:
Roger A. Arnold
Publisher:
Cengage Learning