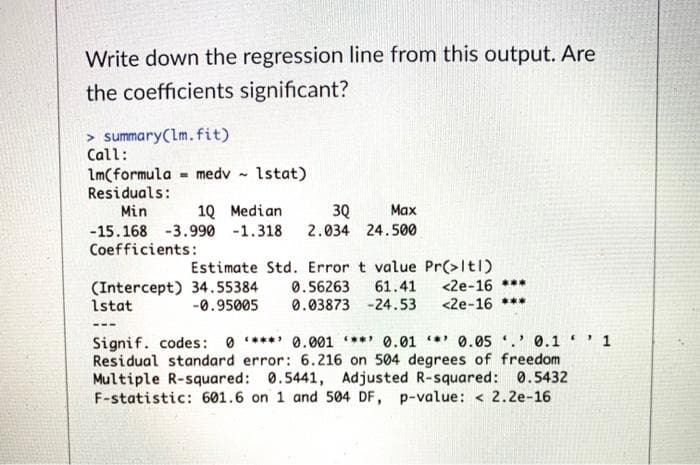
Write down the regression line from this output. Are the coefficients significant?


Q: Above, a table was created to calculate the coefficients of the linear regression y=ax+b model for a…
A:
Q: Explain the assumptions are needed to calculate the various inferential statistics of linear…
A: The assumptions needed for inferential statistics of linear Regression is The dependent variable…
Q: Along with the slope and the intercept, compute the standard erron of the estimate and the…
A: The slope and intercept are calculated below: Excel Procedure: Enter X and Y in Excel Go to Data…
Q: Which command in R to get the coefficients of the regression line?
A: If X is independent variable and Y is dependent variable. The command lm(y~x) will fit the model.…
Q: Use the general equation for the least square regression line to show that this line always passes…
A: The linear regression equation always passes through (x, y)y =a + bxLet there be two variables: x…
Q: Suppose that Y is normal and we have three explanatory unknowns which are also normal, and we have…
A: Given ; Suppose that Y is normal and we have three explanatory unknowns which are also normal.
Q: Use the Third Paired Data Set. Find the equation for the least-squares regression line.
A: 34. Excel Procedure: Enter x and y in Excel>Data>Data Analysis> ‘Regression’>Select y…
Q: ) By hand, determine the least-squares regression line. x + Cound to three decimal places as…
A:
Q: The model developed from sample data that has the form of Yhat = bo +b1X is known as the multiple…
A: The model developed from the sample data that has the form of y^=b0+b1×X is known as the multiple…
Q: asS E is ... ...... 2. In method of least square regression, the value of
A: Regression analysis is a statistical tool for analyzing the average relationship between two or more…
Q: The table below gives the number of hours spent unsupervised each day as well as the overall grade…
A: In multiple linear regression, there will be more than one independent variable. In simple linear…
Q: What is the slope of the least-squares regression line for these data? Carry your intermediate…
A: Given table : cost (x) Sales (y) 4.05 6.97 1.34 6.39 1.69 6.19 2.30 6.63 3.96 6.78…
Q: Find the least-squares regression line ŷ =b0+b1x through the points (-2,2), (2,6), (5,13),…
A: The given points are: -2, 2, 2, 6, 5, 13, 8, 20, 10, 24 Find the least square regression line…
Q: Define the ADL and GLS Estimators of Regression.
A:
Q: Suppose a least-squares regression line is given by y = 4..302x- 3.293. What is the mean value of…
A: Solution: From the given information, a least squares regression line is
Q: Show that the following relationship on the simple linear regression class notebook is true: i=1
A: The given expression is ∑i=1nxiyi-nX¯ Y¯∑i=1nxi2-nX¯2=∑i=1nxi-X¯ yi-Y¯∑i=1nxi-X¯2, here,…
Q: Suppose that as an investor in the stock market, you’re looking for a stock that's going to move in…
A: Given, the regression output. The test statistics corresponding to the claim that there is a…
Q: What is the slope of the least-squares regression line for these data? Carry your intermediate…
A: The data shows the birth rates as x variable and female life expectancy as y variable.
Q: When performing a regression task with multiple target variables, a common approach is to assume…
A: Hello. Since your question has multiple parts, we will solve first question for you. If you want…
Q: If all actual values of the dependent variable lie on the estimated regression line, then the…
A: From the given information, All the actual values of dependent variable are lie on the straight…
Q: In simple linear regression analysis, it is desired to test whether the regression coefficient is…
A: Solution: Given information: Test statistic t = 19 S.E(β1^)= 8 standard error of the regression…
Q: Explain the IV Regression Assumptions?
A: Introduction: A multiple regression analysis is often found to contain endogenous predictor…
Q: = r· Zx
A: Introduction: Consider that x is the independent variable and y is the dependent variable. The size…
Q: Find the equation of the regression line for the given data:
A: Linear regression model A linear regression model corresponds to a linear regression model that…
Q: a. Compute for the correlation coefficient r. b. Compute for the value of m and b. c. Form the…
A: Given:
Q: To determine the effectiveness of group study sessions, a college instructor gathers data on hours…
A: In regression theory, dependent variable is the response variable, which is predicted using the…
Q: It is required to use the data given in the table to estimate the parameters of the simple linear…
A: The given data is x y 0 6 1 2 2 3 3 1 4 0 We use the method of least squares to…
Q: possible estimated errors
A: Let From given values of response and predictor we have to calculate Parameter β0 and β1We Know…
Q: The following table displays the mathematics test scores for a random sample of college students,…
A: There are two variables which are named as Mathematics test and SY16C grades. Mathematics test is…
Q: Calculate the equation of the regression line and calculate the correlation coefficient
A: Correlation is used to measure the mean significance between the two numerical variable. It take…
Q: Find the equation of the regression line for the given data. Round values to the nearest thousandth.…
A:
Q: What is the differed annual expenditures of two families if their annual net incomes are differed by…
A: Let y1 and y2 be the annual expenditures of the familiesand Let x1 and x2 be their net incomes.We…
Q: What is the slope of the least-squares regression line for these data? Carry your intermediate…
A: The random variable x is denoted as the temperature, and y is denoted as electricity use.
Q: If the point representing 64 wins and attendance of 40,786, people per game is removed from the set…
A: Solution : Note : Since we only answer up to 3 sub-parts, we’ll answer the first 3. Please resubmit…
Q: Use the table of x and y values below to determine the slope of the least-squares regression line.
A: Given Data : X Y 0 125 10 120 20 100 30 115 40 115 50 90 60 85 70 65 For…
Q: Use the given data to find the a. Equation of the regression line b. Coefficient of correlation
A: We have to find the regression line and coefficient of correlation r.
Q: Find out the regression coefficients of Y on X and X on Y from the following data: ΣΧ= 50, X= 5 , Σ…
A: It is given that variance of X is 4 and the variance of Y is 9.
Q: determine which set come from the least squares regression model a
A: if we estimate the parameter from the given observation that is response =yi={5,3,2,4} and…
Q: What would the consequence be for a regression model if the errors were not homoscedastic?
A:
Q: Using the regression line, we predict the final score of a student with a midterm score of 70 to be…
A:
Q: A regression line describes the relationship between the dependent and independent variables and can…
A: Solution: As the regression shows the relationship between the independent and dependent variables.…
Q: find the regression line associated with the set of points. (6,7), (8,8), (9,9)
A:
Q: We wish to predict the salary for baseball players (y) using the variables RBI (x1x1) and HR (x2x2),…
A: a) The regression equation can be created in excel as follows: Step 1: Put the data onto the…
Q: The smaller the distance between observed data points and the regression line, the smaller the sum…
A: Smaller SSR indicate better model. SSR used for measuring or determine the dispersion of data…
Q: Find the least square regression line for the data points : (1,1), (2,3). (4,5).
A:
Q: s as needed.) ntercept, if appropriate. Squares regression line
A: NOTE: As per the guidelines, we are supposed to solve the first three sub parts of 1st question…

Step by step
Solved in 3 steps

- Olympic Pole Vault The graph in Figure 7 indicates that in recent years the winning Olympic men’s pole vault height has fallen below the value predicted by the regression line in Example 2. This might have occurred because when the pole vault was a new event there was much room for improvement in vaulters’ performances, whereas now even the best training can produce only incremental advances. Let’s see whether concentrating on more recent results gives a better predictor of future records. (a) Use the data in Table 2 (page 176) to complete the table of winning pole vault heights shown in the margin. (Note that we are using x=0 to correspond to the year 1972, where this restricted data set begins.) (b) Find the regression line for the data in part ‚(a). (c) Plot the data and the regression line on the same axes. Does the regression line seem to provide a good model for the data? (d) What does the regression line predict as the winning pole vault height for the 2012 Olympics? Compare this predicted value to the actual 2012 winning height of 5.97 m, as described on page 177. Has this new regression line provided a better prediction than the line in Example 2?The systolic blood pressure dataset (in the third sheet of the spreadsheet linked above) contains the systolic blood pressure and age of 30 randomly selected patients in a medical facility. What is the equation for the least square regression line where the independent or predictor variable is age and the dependent or response variable is systolic blood pressure? Y=__________ X + ______________ Patient 7 is 67 years old and has a systolic blood pressure of 170 mm Hg. What is the residual? __________ mm Hg Is the actual value above, below, or on the line? What is the interpretation of the residual? (difference in actual &predicated bp, difference in age, the amount of systolic changes)A sociologist was hired by a large city hospital to investigate the relationship between the number of unauthorized days that employees are absent per year and the distance (miles) between home and work for the employee. A sample of 10 employees was chosen, and the following data were collected. A. Is the estimated regression equation appropriate and adequate
- The owner of Showtime Movie Theaters, Inc., would like to predict weekly gross revenueas a function of advertising expenditures. Historical data for a sample of eight weeks follow. Weekly GrossRevenue($1000s) Television Advertising($1000s) Newspaper Advertising($1000s) 96 5.0 1.5 90 2.0 2.0 95 4.0 1.5 92 2.5 2.5 95 3.0 3.3 94 3.5 2.3 94 2.5 4.2 94 3.0 2.5 a. Develop an estimated regression equation with the amount of televisionadvertising as the independent variable.b. Develop an estimated regression equation with both television advertising and newspaper advertising as the independent variables. c. Is the estimated regression equation coefficient for television advertisingexpenditures the same in part (a) and in part (b)? Interpret the coefficient in each case. d. Predict weekly gross revenue for a week when $3500 is spent on television advertising and $1800 is spent on newspaper advertising.The Mayor of texas whom is partners with a local agriculturalist wants to know how the amount of fertilizer and the amount of water given to plants affect their growth. The results were inputted into MINITAB so as to fit the model a) Write out the regression equation b) What is the sample size used in this investigation? c) Determine the values of *, ** and ***, **** d) Conduct a hypothesis test, at the 5% level of significance, to determine whether ? is significant. e) What would be the growth of the plant if 4g of fertilizer and 7g of ater was given to it daily? f) Carry out an F -test at the 1% significance level to determine whether the model is significantIn a certain type of metal test specimen, the normal stress on a specimen is known tobe functionally related to the shear resistance. The following is a set of codedexperimental data on the two variables:Normal stress (X) 26.8 25.4 28.9 23.6 27.7 23.9 24.7Shear resistance (Y) 26.5 27.3 24.2 27.1 23.6 25.9 26.3i) Estimate the linear regression line and interpret regressioncoefficient.ii) Comment about of goodness of fit of the estimated regression line.
- The owner of Showtime Movie Theaters, Inc. would like to predict weekly gross revenue as a function of advertising expenditures. Historical data for a sample of eight weeks follow. Weekly GrossRevenue($1000s) TelevisonAdvertising($1000s) NewspaperAdvertising($1000s) 96 5.0 1.5 90 2.0 2.0 95 4.0 1.5 92 2.5 2.5 95 3.0 3.3 94 3.5 2.3 94 2.5 4.2 94 3.0 2.5 Part A: Develop an estimated regression equation with the amount of television advertising as the independent variable. Part B: Develop an estimated regression equation with both television advertising and news paper advertising as independent variables. Part C: Is the estimated regression rquation coefficient for television advertising expenditures the same in part (a) and in part (b) ? Interpret the coefficient in each case. Part D : Predict Weekly gross revenue for a week $3500 is spent on television advertising and $1800 is spent on newspaper advertising? Please hurryJensen Tire & Auto is deciding whether to purchase a maintenance contract for its newcomputer wheel alignment and balancing machine. Managers feel that maintenance expenseshould be related to usage, and they collected the following information on weeklyusage (hours) and annual maintenance expense (in hundreds of dollars). a. Develop a scatter chart with weekly usage hours as the independent variable. Whatdoes the scatter chart indicate about the relationship between weekly usage and annualmaintenance expense?b. Use the data to develop an estimated regression equation that could be used to predictthe annual maintenance expense for a given number of hours of weekly usage. Whatis the estimated regression model? c. Test whether each of the regression parameters b0 and b1 is equal to zero at a 0.05level of significance. What are the correct interpretations of the estimated regressionparameters? Are these interpretations reasonable?d. How much of the variation in the sample values of…The sheet called HousePr contains data on prices of houses that have sold recently and two attributes of the house – the number of bedrooms and the size. Column 1 is the selling price of the house in thousands of dollars and column 2 is the size in hundreds of square feet.A. What is the expected price for a house with size 2000 square feet? Using relevant Excel output, discuss whether the margin of error of this expected price will be low or high.B. Using Excel, obtain the equation of the linear regression line that fits this data for price vs. number of bedrooms. Is the true slope different from zero?C. Which of these two variables – number of bedrooms or size, is the better predictor for price and why? Price SqrFoot Bedrooms731 21 4901 22 4736 16 3866 19 3697 12 2836 17 3694 17 3843 18 3721 15 4883 18 2913 17 3868 17 3642 17 3884 17 3810 16 2841 16 3779 17 4726 16 3667 14 2870 21 4834 16 2776 19 4681 14 2846 19 4917 20 4946 23 5813 20 4911 18 3723 17 3711 15 2897 19 4881 22 4863 19…
- Which of the following does not need to be computed to determine a simple regression line? SSx SP "Y-hat" SSyThe owner of Original Italian Pizza restaurant chain wants to understand which variable most strongly influences the sales of his specialty deep-dish pizza. He has gathered data on the monthly sales of deep-dish pizzas at his restaurants and observations on other potentially relevant variables for each of several outlets in central Indiana. These data are provided in the file P10_04.xlsx. Estimate a simple linear regression equation between the quantity sold (Y) and each of the following candidates for the best explanatory variable: average price of deep-dish pizzas (X1), monthly advertising expenditures (X2), and disposable income per household in the areas surrounding the outlets (X3). Round your answers for intercept coefficients to the nearest whole number and slope coefficients to two decimal places, if necessary. If your answer is negative number, enter "minus" sign.Which of the multivariate regression parameters listed below would be best interpreted as: the predicted value on the dependent variable when all of the independent variables in the model are equal to zero. a b1 X1 R2
