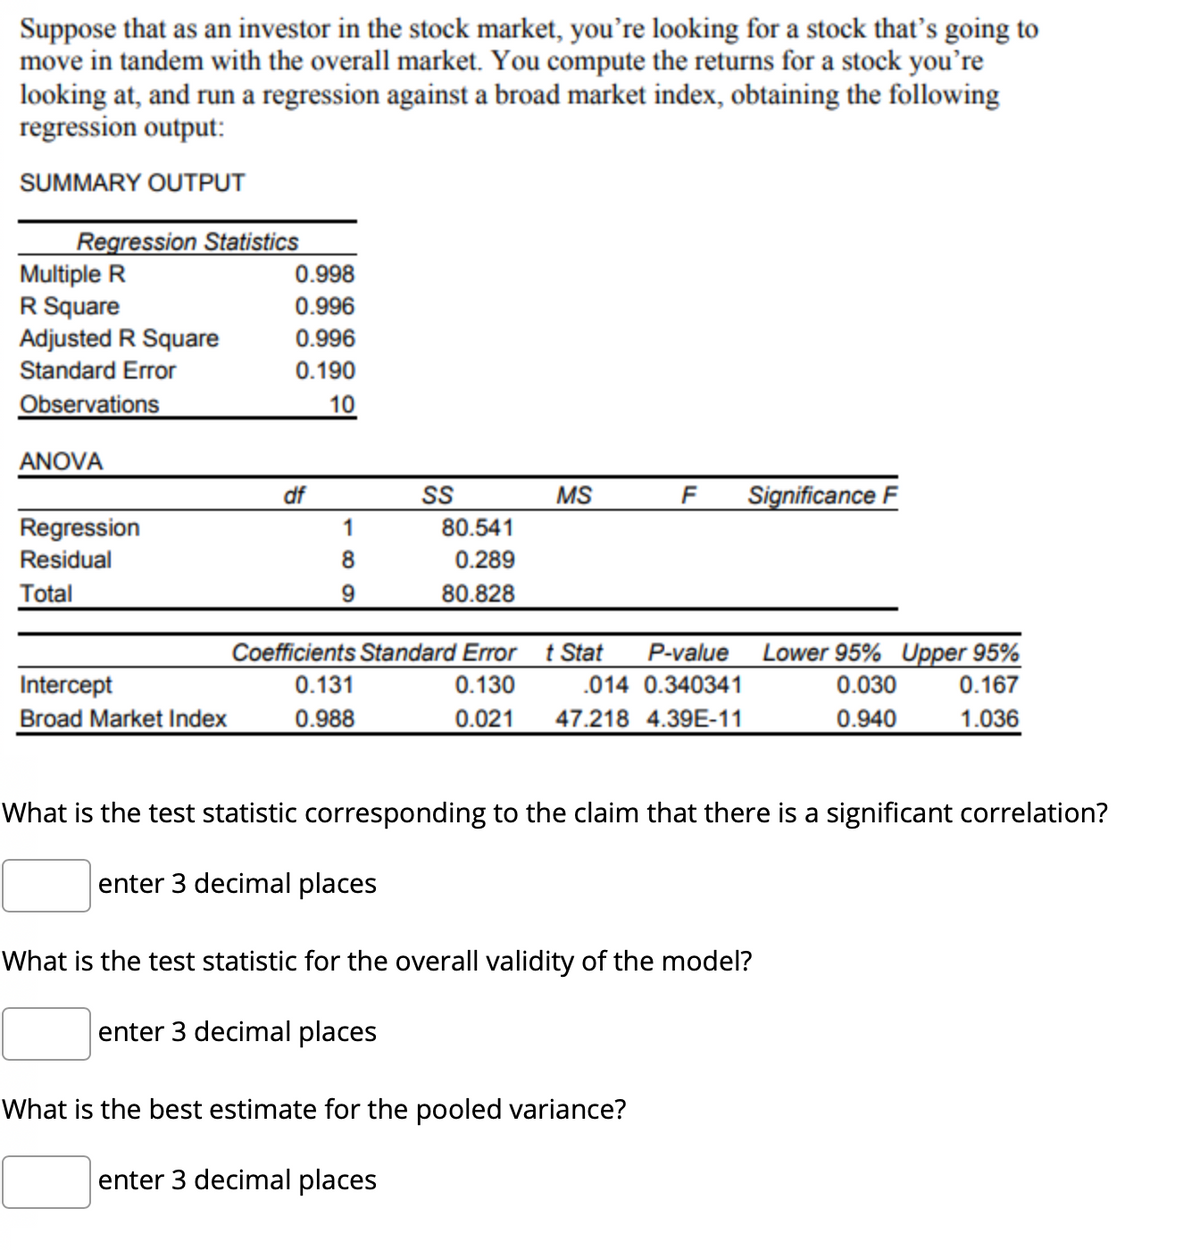
Suppose that as an investor in the stock market, you’re looking for a stock that's going to move in tandem with the overall market. You compute the returns for a stock you're looking at, and run a regression against a broad market index, obtaining the following regression output:

Linear Algebra: A Modern Introduction
4th Edition
ISBN:9781285463247
Author:David Poole
Publisher:David Poole
Chapter7: Distance And Approximation
Section7.3: Least Squares Approximation
Problem 31EQ
icon
Related questions
icon
Concept explainers
Question
Suppose that as an investor in the stock market, you're looking for a stock that's going to
move in tandem with the overall market. You compute the returns for a stock you're
looking at, and run a regression against a broad market index, obtaining the following
regression output:
SUMMARY OUTPUT
Regression Statistics
Multiple R
R Square
Adjusted R Square
Standard Error
0.998
0.996
0.996
0.190
Observations
10
ANOVA
df
SS
MS
F
Significance F
Regression
1
80.541
Residual
8
0.289
Total
80.828
Coefficients Standard Error t Stat
P-value
Lower 95% Upper 95%
Intercept
0.131
0.130
.014 0.340341
0.030
0.167
Broad Market Index
0.988
0.021
47.218 4.39E-11
0.940
1.036
What is the test statistic corresponding to the claim that there is a significant correlation?
enter 3 decimal places
What is the test statistic for the overall validity of the model?
enter 3 decimal places
What is the best estimate for the pooled variance?
enter 3 decimal places
Transcribed Image Text:Suppose that as an investor in the stock market, you're looking for a stock that's going to move in tandem with the overall market. You compute the returns for a stock you're looking at, and run a regression against a broad market index, obtaining the following regression output: SUMMARY OUTPUT Regression Statistics Multiple R R Square Adjusted R Square Standard Error 0.998 0.996 0.996 0.190 Observations 10 ANOVA df SS MS F Significance F Regression 1 80.541 Residual 8 0.289 Total 80.828 Coefficients Standard Error t Stat P-value Lower 95% Upper 95% Intercept 0.131 0.130 .014 0.340341 0.030 0.167 Broad Market Index 0.988 0.021 47.218 4.39E-11 0.940 1.036 What is the test statistic corresponding to the claim that there is a significant correlation? enter 3 decimal places What is the test statistic for the overall validity of the model? enter 3 decimal places What is the best estimate for the pooled variance? enter 3 decimal places
Expert Solution
trending now

Trending now

This is a popular solution!

steps

Step by step

Solved in 2 steps

Blurred answer
Knowledge Booster
Correlation, Regression, and Association
Learn more about
Need a deep-dive on the concept behind this application? Look no further. Learn more about this topic, statistics and related others by exploring similar questions and additional content below.
Similar questions
  • SEE MORE QUESTIONS
Recommended textbooks for you
Linear Algebra: A Modern Introduction
Algebra
ISBN:
9781285463247
Author:
David Poole
Publisher:
Cengage Learning
Glencoe Algebra 1, Student Edition, 9780079039897…
Algebra
ISBN:
9780079039897
Author:
Carter
Publisher:
McGraw Hill