(x, y) have the fame poef weer is given by t [ f (nry) = -128 \4 | <2, 02 01 otherwise you have to show the regression of a any as you a I't Wheel, ilgut pafhestion The sales and 8/² nicht ا ان
(x, y) have the fame poef weer is given by t [ f (nry) = -128 \4 | <2, 02 01 otherwise you have to show the regression of a any as you a I't Wheel, ilgut pafhestion The sales and 8/² nicht ا ان

MATLAB: An Introduction with Applications
6th Edition
ISBN:9781119256830
Author:Amos Gilat
Publisher:Amos Gilat
Chapter1: Starting With Matlab
Section: Chapter Questions
Problem 1P

Related questions
Question
Don't copy and paste the answer, dont give the answer in incomplete steps and don't give the wrong answer, will give the downvote for these mistakes.
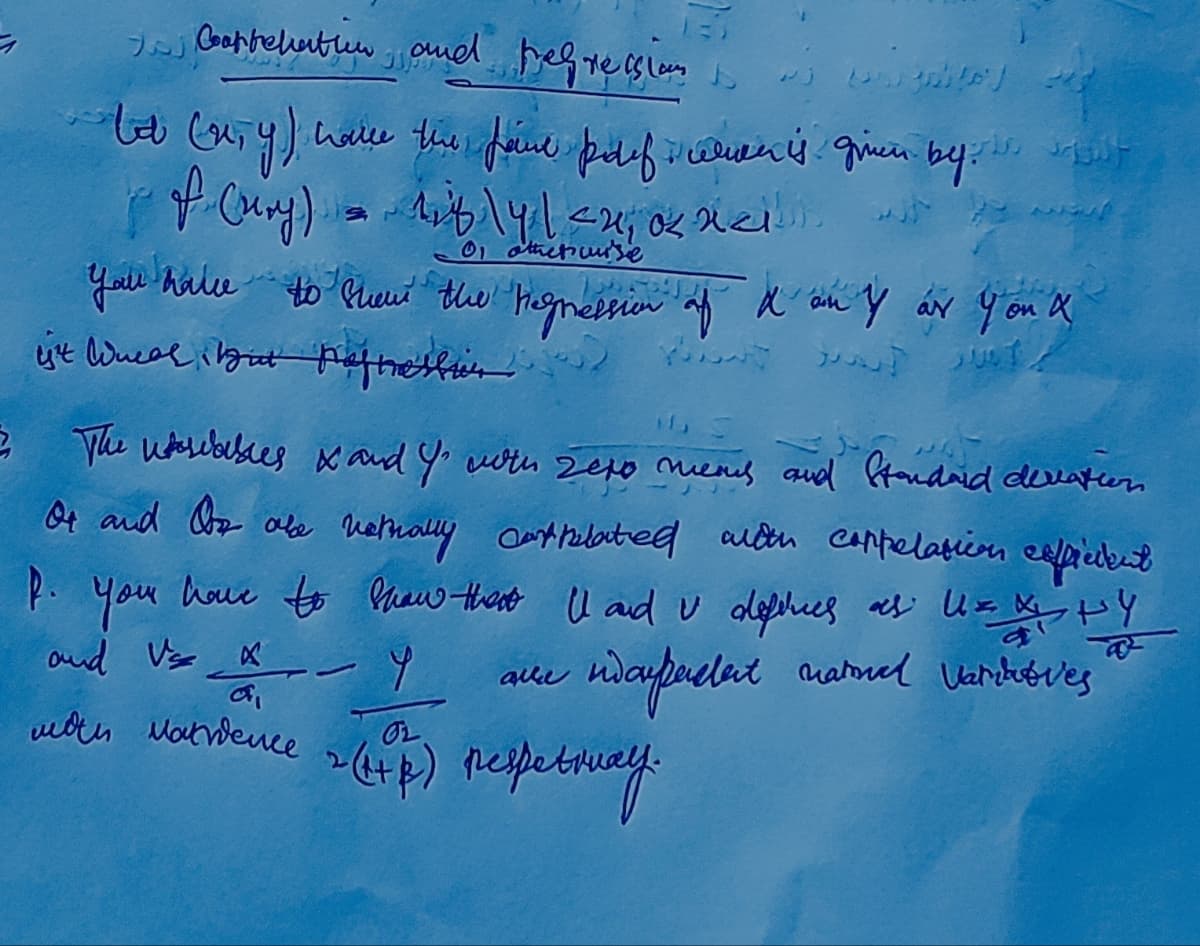
Transcribed Image Text:ㅋ
I Carrelation and regressioni
tot (x,y) have the faire polif alien is given by t
of (ury) = 118\4 | <2, 0 nell
01 otherwise
you have to show the regression of d'on & ar you a
ist Weal but aftellit Hot
2 The wsables & and Y' with sexo mens and Standard deviation
Or and Oor obe netrally cantrelated with coppelation efficient
p. You have to show that I and u definies as UxX HY
U=
ndaypacent national varit ves
and Vs X
мои Матвеше
74
www
alle
OL
2 (HP) respetway.
Expert Solution
This question has been solved!
Explore an expertly crafted, step-by-step solution for a thorough understanding of key concepts.

Step by step
Solved in 2 steps with 2 images

Recommended textbooks for you
MATLAB: An Introduction with Applications
Statistics
ISBN:
9781119256830
Author:
Amos Gilat
Publisher:
John Wiley & Sons Inc

Probability and Statistics for Engineering and th…
Statistics
ISBN:
9781305251809
Author:
Jay L. Devore
Publisher:
Cengage Learning

Statistics for The Behavioral Sciences (MindTap C…
Statistics
ISBN:
9781305504912
Author:
Frederick J Gravetter, Larry B. Wallnau
Publisher:
Cengage Learning
MATLAB: An Introduction with Applications
Statistics
ISBN:
9781119256830
Author:
Amos Gilat
Publisher:
John Wiley & Sons Inc
Probability and Statistics for Engineering and th…
Statistics
ISBN:
9781305251809
Author:
Jay L. Devore
Publisher:
Cengage Learning
Statistics for The Behavioral Sciences (MindTap C…
Statistics
ISBN:
9781305504912
Author:
Frederick J Gravetter, Larry B. Wallnau
Publisher:
Cengage Learning

Elementary Statistics: Picturing the World (7th E…
Statistics
ISBN:
9780134683416
Author:
Ron Larson, Betsy Farber
Publisher:
PEARSON

The Basic Practice of Statistics
Statistics
ISBN:
9781319042578
Author:
David S. Moore, William I. Notz, Michael A. Fligner
Publisher:
W. H. Freeman

Introduction to the Practice of Statistics
Statistics
ISBN:
9781319013387
Author:
David S. Moore, George P. McCabe, Bruce A. Craig
Publisher:
W. H. Freeman