X. IQ Scores Medium Lead Level O High Lead Level 72 n2 11 84 92 X2% D 88.555 85 87 S2 = 10.083 %3D 97 83 92 101 111 91 Print Done
X. IQ Scores Medium Lead Level O High Lead Level 72 n2 11 84 92 X2% D 88.555 85 87 S2 = 10.083 %3D 97 83 92 101 111 91 Print Done

Algebra & Trigonometry with Analytic Geometry
13th Edition
ISBN:9781133382119
Author:Swokowski
Publisher:Swokowski
Chapter10: Sequences, Series, And Probability
Section10.8: Probability
Problem 10E

Related questions
Question
100%
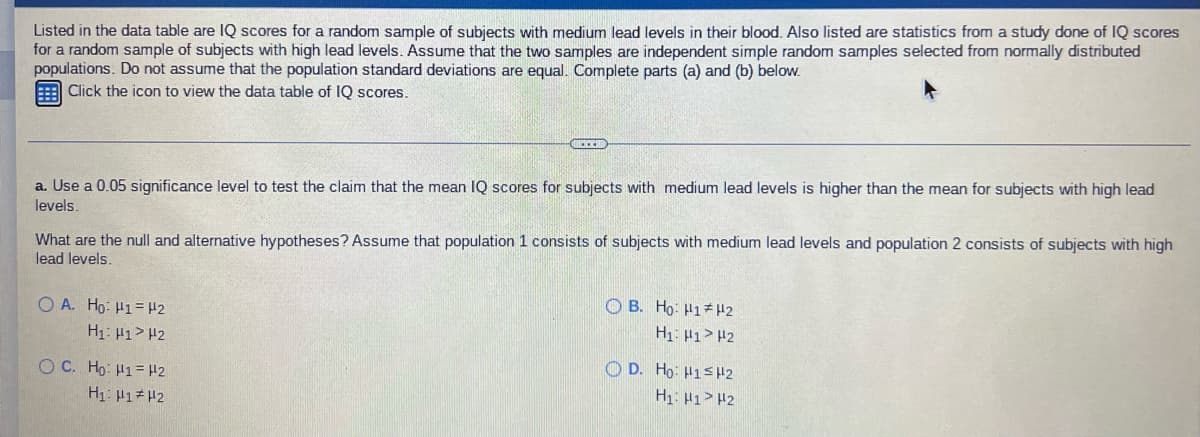
Transcribed Image Text:Listed in the data table are IQ scores for a random sample of subjects with medium lead levels in their blood. Also listed are statistics from a study done of IQ scores
for a random sample of subjects with high lead levels. Assume that the two samples are independent simple random samples selected from normally distributed
populations. Do not assume that the population standard deviations are equal. Complete parts (a) and (b) below.
Click the icon to view the data table of IQ scores.
a. Use a 0.05 significance level to test the claim that the mean IQ scores for subjects with medium lead levels is higher than the mean for subjects with high lead
levels.
What are the null and alternative hypotheses? Assume that population 1 consists of subjects with medium lead levels and population 2 consists of subjects with high
lead levels.
O B. Ho: H1*H2
O A. Ho: H1= H2
H1: H1> #2
H1: H1> H2
O C. Ho: H1= H2
D. Ho: H1SH2
H1: H1> H2
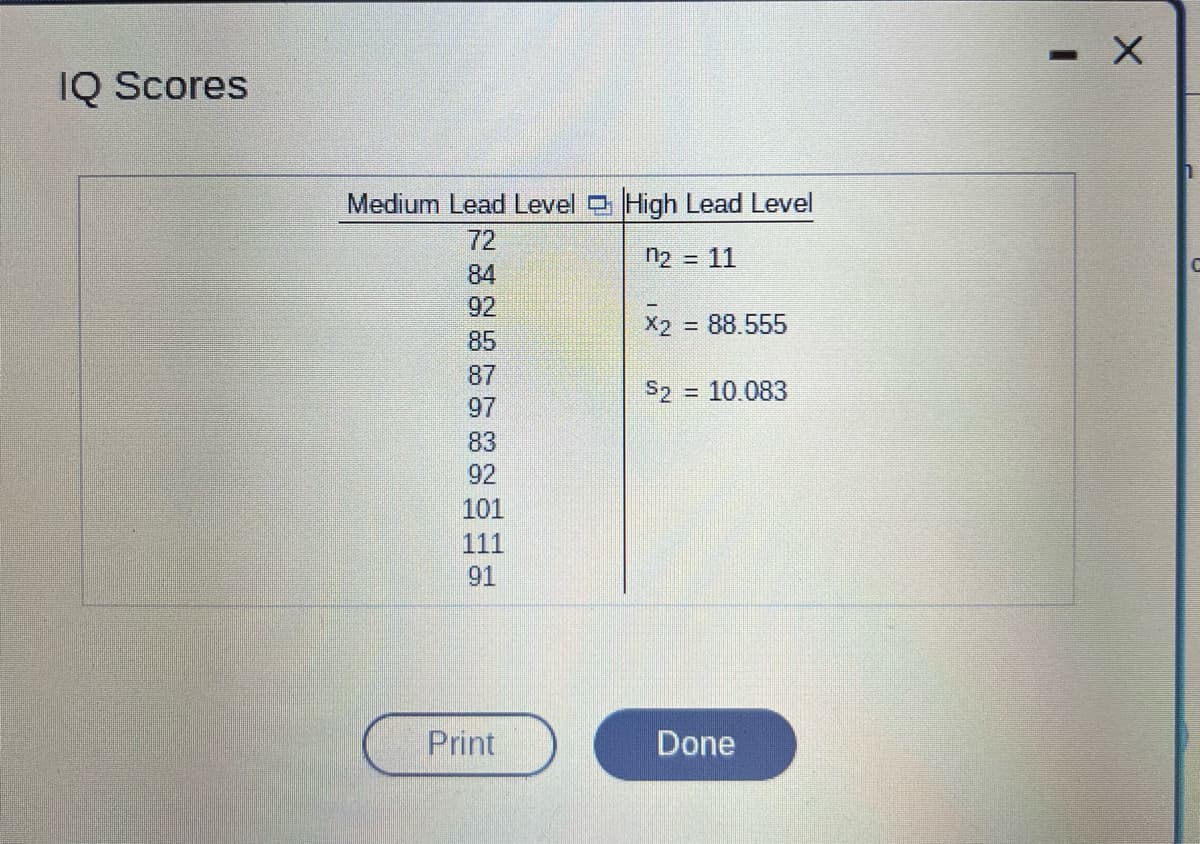
Transcribed Image Text:IQ Scores
Medium Lead Level O High Lead Level
72
n2 = 11
84
92
X2
= 88.555
85
87
S2 = 10.083
%3D
97
83
92
101
111
91
Print
Done
Expert Solution
This question has been solved!
Explore an expertly crafted, step-by-step solution for a thorough understanding of key concepts.

Step by step
Solved in 2 steps with 2 images

Recommended textbooks for you
Algebra & Trigonometry with Analytic Geometry
Algebra
ISBN:
9781133382119
Author:
Swokowski
Publisher:
Cengage

Linear Algebra: A Modern Introduction
Algebra
ISBN:
9781285463247
Author:
David Poole
Publisher:
Cengage Learning

Functions and Change: A Modeling Approach to Coll…
Algebra
ISBN:
9781337111348
Author:
Bruce Crauder, Benny Evans, Alan Noell
Publisher:
Cengage Learning
Algebra & Trigonometry with Analytic Geometry
Algebra
ISBN:
9781133382119
Author:
Swokowski
Publisher:
Cengage
Linear Algebra: A Modern Introduction
Algebra
ISBN:
9781285463247
Author:
David Poole
Publisher:
Cengage Learning
Functions and Change: A Modeling Approach to Coll…
Algebra
ISBN:
9781337111348
Author:
Bruce Crauder, Benny Evans, Alan Noell
Publisher:
Cengage Learning