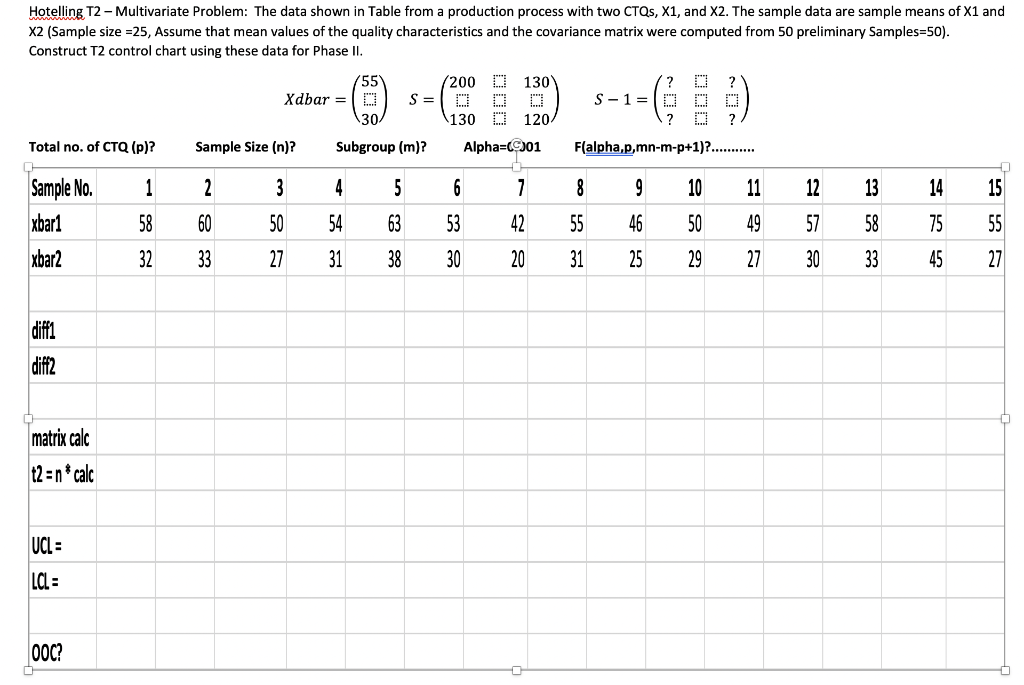
Xdbar = (O S = D D O \130 D 120/ S-1 = (0 D O ? D ? \30 Q (p)? Sample Size (n)? Subgroup (m)? Alpha=CC01 F(alpha,p,mn-m-p+1)?. . 1 3 4 5 6 9 10 11 12 13 58 60 50 54 63 53 42 55 46 50 49 57 58 32 33 27 31 38 30 20 31 25 29 27 30 33 2.


Q: Example 15-5. X;, (i = 1, 2, mean and common variance o?. n) are independently and normally…
A:
Q: Q7. Let x1, x2, ... Xn be an iid sample with pdf f(x|0) = 0xº-1,0 0 %3D Find the MLE of 0.
A:
Q: Reject H0 if t > -1.6604. Reject H0 if t > -1.9842. Reject H0 if t > 1.9842 or Z <…
A:
Q: 6. The data in the table provided represent 13 randomly selected cases of seismic activity…
A: The data is given as below x y 60 4.1 77.5 4 50.7 2.6 65.6 2.8 48.2 0.9 63.5 2.2…
Q: If the total population351, and sample size%=6 and number of total sucsesss=D10 for Hypergeometric…
A: There are two types of variables: continuous and discrete. Continuous variables can take any value…
Q: An appropriate sampling time for the signal x(t)=cos(Tt)
A: Period of the signal is 2. So using Nyquist criterion the appropriate sampling time will be half of…
Q: Refer to the accompanying data display that results from a sample of airport data speeds in Mbps.…
A: We have to find margin of error.
Q: Let {e,, e, ***, e,} be a random sample of e. e- N(0, o'), where o >0. Let Y,-a+ e,, for i-1,nand…
A: Given that, e1,e2,...,en~N(0,σ2)Where, σ2>0Yi=α+ei ; i=1:n
Q: Q1. An anthropologist wants to collect data to determine whether the two different cultural groups…
A: 1. If the value of population standard deviations is known then we use Z-statistic for the…
Q: A sample of n = 81 from a population of u = 80 and o = 18 has a mean M = 81. What is the z-score for…
A: Solution-: Given: n=81,μ=80,σ=18,M=18 We find the z-score for the sample means?
Q: Q7. Let x,, X2, ... Xn be an iid sample with pdf f(x|0) = 0xº=1,0 0 Find the MLE of 0.
A:
Q: Q.No.2. An experiment was performed with seven hop plants. One half of each was pollinated and the…
A: In the given experiment, independent samples are taken and sample size = n = 7 < 30 . Therefore…
Q: If x(t) = 2 ť, is sampled with T =1 sec. What's the first five samples? x(0) = 0, x(1) = -2, x(2) =…
A: Put the values of t=0,1,2,3,4 in x(t)=2t^2 then we get the answer
Q: Let X1, ..., Xn be iid N (µ, o) and suppose we are interested in estimating t(µ, 0) = o². The…
A: Since there are multiple questions we will answer the first one. Introduction - Normal distribution…
Q: A random sample of size 51 yielded E1 X = 1.023 and E1(x;-x)² = 2. 44. Find the p-value for testing…
A:
Q: Find the distribution name and parameters for U=Y1+Y2 in each of these two cases: (a) independent…
A: Part a: Given Y1 and Y2 are independently and identically distributed as Gamma( α= 2; β = 5)…
Q: Consider a random sample X1,..., X, from the p.d.f. fo(x) = (1+ 0x), –2 < x < 2, Here 0 € (-1/2,…
A: E(x)=∫xf(x)dxE(X2)=∫X2f(x)dxvar(x)=E(X2)-(E(X))2 NOTE According to Bartleby expert guidline, we can…
Q: m samples of size 525 are taken from an inf A 0.2100 B. 0.0200 C. 0.0004 OD. 0.3000
A: The standard error formula for proportion is: SE=p(1-p)n Given: n=525 p =0.3
Q: A CI is desired for the true average stray-load loss ? (watts) for a certain type of induction motor…
A:
Q: Theorem:- af, X2, 13, Xy , Ng be The Yandom sample of size 5 from normal papulation. t, to = 2 t3 =…
A:
Q: Let X1, X2 .. with parameters a Discuss the construction of 98 percent C.I for B ,X6 be a r.s.of…
A:
Q: Consider the model yy= A + y for i= 1,..t and j=1,.. Given the follow th trt 3. 6. 4. 36.4 21.6 18.3…
A:
Q: 42. If X is a Poisson variate, such that P(X = 2)=9(X =4)+90P(X =6) %3D Find i) 1, the mean of X and…
A:
Q: A random sample of n = 16 communities in eastern New Mexico gave the following information for…
A: n1 = 16n2 = 14 x1 = 109.5x2 = 99.36 s1 = 15.41s2 =11.57
Q: answer b The following table shows the number of shirts by sizes that are manufactured in a factory…
A: The different level of measurement is given as follows- Nominal scale: It is the categorical…
Q: Suppose (X, Y) is bivariate normal with E(X) = 0 = E(Y), Var(X) ² = Var(Y) and a correlation…
A: Given: E [X] = 0 E [ Y] = 0 V [ X] = σ2 V [ Y] = σ2 ρ=0.4 Q=X2+Y-ρX21-ρ2
Q: b) Two candidates X and Y at the B.A (Hons.) examination obtained the following marks in ten papers:…
A: Given - Marks in 10 papers of two candidates X and Y n = 10
Q: CT composite scores are normally distributed with a μ = 21. A sample of 25students is randomly…
A: From the given information, Sample size n =25 sample mean, x̅=23 sample standard deviation, s=5.2…
Q: 1. Let X1,..., X, be an iid sample from Bernoulli(p). (a) Find the method of moment estimator of p.…
A:
Q: en} be a random sample of e. e~ N(0, o²), where o >0. Let Y, = a+ e;, for Let {e,, e2, ', i = 1,…
A: Answer: a. G is an unbiased estimator.
Q: An i.i.d sample (X1, X2) are distributed as a bivarate normal as follows: X1 of σ12 X2 Suppose that…
A:
Q: Q1. An anthropologist wants to collect data to determine whether the two different cultural groups…
A: “Since you have asked multiple questions, we will solve the first question for you. If you want any…
Q: The one-sample t statistic for testing H0:μ=0H0:μ=0 Ha:μ>0Ha:μ>0 from a sample of n = 15…
A:
Q: Verify the following statistical identities: a) E (T; – T)² = E1 x} – nữ² b) E1(C; – T)(y: – 9) =…
A: Since you have posted a question with multiple sub-parts, we will solve first three sub-parts for…
Q: .l let x denote the minimum arder Statistics of from fw- eK-e) arandam Sample Lek Zn: ncメャ-9) Find…
A: Solution : Given that, f(x)=e-(x-θ) , θ<x<∞…
Q: With a = .01 the two-tailed critical region for at test using a sample of n=16 subjects would have…
A: Given α=0.01test is two-tailedn=16
Q: Question 7 Suppose the distribution of Y, conditional on X, is n(x, x²) and that the marginal…
A:
Q: Let A be the mean of the random sample drawn from a population whose pdf is given by fox =…
A: Note: Hi, thank you for the question. As per our company guideline we are supposed to answer only…
Q: Q1. An anthropologist wants to collect data to determine whether the two different cultural groups…
A: Solution
Q: Sf(z) = 1/4 te (0, 3) Suppose that X has mixed distribution Find and e, for J. p(z) = | te D= {6}. T…
A: Given that the random variable X has mixed distribution fx=14 ; t∈0,3px=14 ; t∈D=6
Q: uestion 1 Vhich of the following would be the LSRL for the given data? x2 7 8 11 17 16 y 23 28 40 28…
A: We want to find the regression equation
Q: Q1. An anthropologist wants to collect data to determine whether the two different cultural groups…
A:
Q: Q1. An anthropologist wants to collect data to determine whether the two different cultural groups…
A: The following information has been provided: Sample Mean 1 (Xˉ1)(\bar X_1) = 62.762.7 Sample…
Q: 1. Which of the following is FALSE for a continuous random variable X with pdf y = f(x)? %3D A. P(6…
A: Given that Probability density function (pdf) y=f(x)
Q: - Let I = 1.135013 be the sample mean of an iid sample r1,..., x50 from a gamma population Gamma(1,…
A: Given that the sample mean of an i.i.d random sample x1, x2, ..., x50 from a gamma population Gamma…
Q: Give the marginal probability of (e) * X = number of Bars of Signal Strength Y = response time…
A: Marginal probability of a random variable is the unconditional probability irrespective of other…
Q: If the total population351, and sample size%=6 and number of total sucsesss=D10 for Hypergeometric…
A:
Q: State wh 362 The iegree of treedom of t-test for independent samples (where oy & oz are unknown and…
A: Given data, n1=37 n2=43 Given df=79
Q: 12. Establish the formula nro,0y = n¡r¡Ox, Oy, + N2r20xOy, + n¡dx, dy, + nzdz, dy where n1, n2 and n…
A:
5


Trending now
This is a popular solution!

Step by step
Solved in 2 steps with 1 images

- If in a multivariate regression model with significant F-value, all the estimated parameters have computed-t values less than 1, then the model is likely to have _____. Select one: a. partial correlation for each regressor is insignificant b. some or all the regressors are linearly dependent c. a problem of multicollinearity d. all of the aboveQ3 - Returns on stocks X and Y are listed below: Period 1 2 3 4 5 6 7Stock X 3% -2% 9% 6% -1% -4% 11%Stock Y 1% -4% 7% 12% 3% -2% -1% Consider a portfolio of 20% stock X and 80% stock Y. What is the (population) variance of portfolio returns? Please round your answer to six decimal places.Q3 - Returns on stocks X and Y are listed below: Period 1 2 3 4 5 6 7Stock X 5% 6% -2% -4% 6% 10% 7%Stock Y 1% -3% 6% 3% 12% 7% -5% Consider a portfolio of 40% stock X and 60% stock Y. What is the (population) variance of portfolio returns?Please round your answer to six decimal places.
- E3 a) Distinguish between the Population Regression Function (PRF) and the Sample Regression Function (SRF) using appropriate formula and specifications for each function. b) Outline the Gauss-Markov assumptions associated with the Classical Linear Regression Model (CLRM) and discuss their significance. State any additional assumption that is required for hypotheses testing. Ensure to elaborate on BLUE properties of OLS estimators.Engro group, who recently sold its Engro foods start-up for a multi-million-rupees sum, is looking for another investment for fresh capital. It is considering an investment in coal (X) and solar (Y) power plant. For that they had a collected data on 5 different characteristics. Amanda has applied k-means clustering to this data for k = 2. Given the following data: Table 5.1 Observations X Y 1 20 18 2 8 20 3 36 26 4 22 12 5 14 4 Visually represent the clusters of both parts9)Suppose that Y is normal and we have three explanatory unknowns which are also normal, and we have an independent random sample of 11 members of the population, where for each member, the value of Y as well as the values of the three explanatory unknowns were observed. The data is entered into a computer using linear regression software and the output summary tells us that R-square is 0.79, the linear model coefficient of the first explanatory unknown is 7 with standard error estimate 2.5, the coefficient for the second explanatory unknown is 11 with standard error 2, and the coefficient for the third explanatory unknown is 15 with standard error 4. The regression intercept is reported as 28. The sum of squares in regression (SSR) is reported as 79000 and the sum of squared errors (SSE) is 21000. From this information, what is the adjusted R-square? .8 .7 NONE OF THE OTHERS .6 .5
- 17) Suppose that Y is normal and we have three explanatory unknowns which are also normal, and we have an independent random sample of 41 members of the population, where for each member, the value of Y as well as the values of the three explanatory unknowns were observed. The data is entered into a computer using linear regression software and the output summary tells us that R-square is 0.9, the linear model coefficient of the first explanatory unknown is 7 with standard error estimate 2.5, the coefficient for the second explanatory unknown is 11 with standard error 2, and the coefficient for the third explanatory unknown is 15 with standard error 4. The regression intercept is reported as 28. The sum of squares in regression (SSR) is reported as 90000 and the sum of squared errors (SSE) is 10000. From this information, what is the number of degrees of freedom for the t-distribution used to compute critical values for hypothesis tests and confidence intervals for the individual…9) The following results are from a regression where the dependent variable is GRADUATION RATE and the independent variables are % OF CLASSES UNDER 20, % OF CLASSES OF 50 OR MORE, STUDENT/FACULTY RATIO, ACCEPTANCE RATE, 1ST YEAR STUDENTS IN TOP 10% OF HS CLASS. The data were split into 2 samples and the following regression results were obtained from the split data. a) What is heteroscedasticity? (b) Why is heteroscedasticity a problem? c) Based on a comparison of the two sets of output, does it appear that there is heteroscedasticity in the data set? Explain. Be sure to write down your null and alternative hypothesis, calculate the test statistic, and find your critical value (test at the 5% level of significance).8)Suppose that Y is normal and we have three explanatory unknowns which are also normal, and we have an independent random sample of 11 members of the population, where for each member, the value of Y as well as the values of the three explanatory unknowns were observed. The data is entered into a computer using linear regression software and the output summary tells us that R-square is 0.86, the linear model coefficient of the first explanatory unknown is 7 with standard error estimate 2.5, the coefficient for the second explanatory unknown is 11 with standard error 2, and the coefficient for the third explanatory unknown is 15 with standard error 4. The regression intercept is reported as 28. The sum of squares in regression (SSR) is reported as 86000 and the sum of squared errors (SSE) is 14000. From this information, what is MSE/MST? .5000 NONE OF THE OTHERS .2000 .3000 .4000
- 3- Heteroskedasticity refers to the residuals from a regression model Select one:Being linearBeing independentHaving a constant varianceHaving time-dependent varianceClear my choiceA scatterplot of student height, in inches, versus corresponding arm span length, in inches, is shown below. One of the points in the graph is labeled A. If the point labeled A is removed, which of the following statements would be true? The slope of the least squares regression line is unchanged and the correlation coefficient increases. The slope of the least squares regression line is unchanged and the correlation coefficient decreases. The slope of the least squares regression line increases and the correlation coefficient increases. The slope of the least squares regression line increases and the correlation coefficient decreases. The slope of the least squares regression line decreases and the correlation coefficient increases.2. An article in the Tappi Journal (March, 1986) presented data on green liquor Na2S concentration (in grams per liter) and paper machine production (in tons per day). The data (read from a graph) are shown as follows: (a) Fit a simple linear regression model with y green liquor Na2S concentration and x production. Draw a scatter diagram of the data and the resulting least squares fitted model.(b) Find the fitted value of y corresponding to x = 910 and the associated residual.
