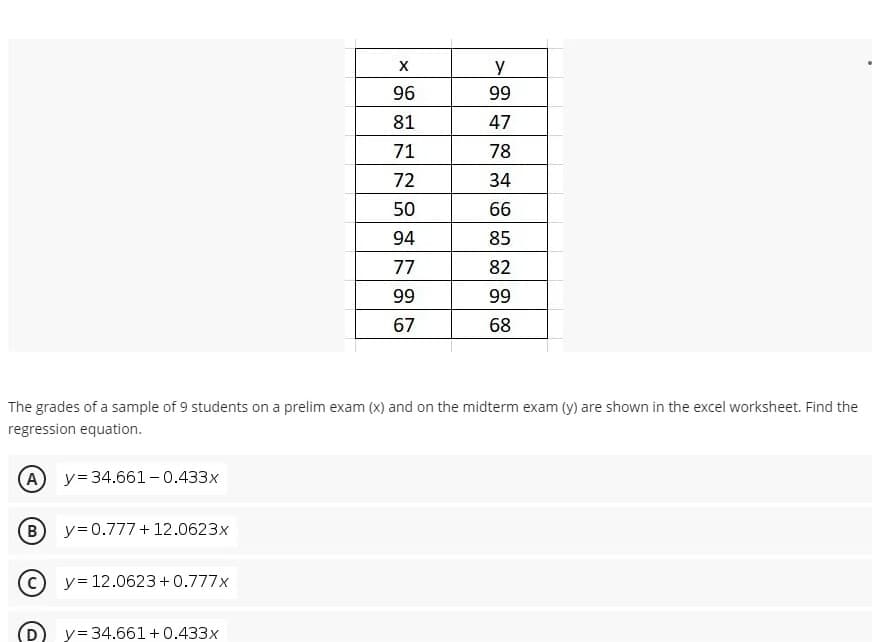
y 96 99 81 47 71 78 72 34 50 66 94 85 77 82 99 99 67 68 The grades of a sample of 9 students on a prelim exam (x) and on the midterm exam (y) are shown in the excel worksheet. Find the regression equation. A y= 34.661 -0.433x


Q: Find the regression equation, letting the first variable be the predictor (x) variable. Using the…
A: Given Information: The data represents the ages of actress and actors in various years. The…
Q: Find the regression equation, letting the first variable be the predictor (x) variable. Using the…
A: For the given data find the regression equation
Q: Find the regression equation, letting the first variable be the predictor (x) variable. Using the…
A:
Q: Given a regression line y=0.354x - 3.326, predict the number of games won for a team that scored 69…
A: In this case, the equation for the least squares is y=0.354x - 3.326. Predict the number of games…
Q: Find the regression equation, letting the first variable be the predictor (x) variable. Using the…
A: Given n=12 X=32
Q: Find the regression equation, letting the first variable be the predictor (x) variable. Using the…
A:
Q: Find the regression equation, letting the first variable be the predictor (x) variable. Using the…
A: Calculate the following values: x y (x - mean_x)2 (y - mean_y)2 (x - mean_x)*(y - mean_y) 27…
Q: Find the regression equation, letting the first variable be the predictor (x) variable. Using the…
A: Use the given data to form the excel table: X Y X*Y X*X 27 43 1161 729 30 35 1050…
Q: In a regression analysis, if SSE = 200 and SSR = 300, then the coefficient of determination is A.…
A: Since you have asked multiple questions, we will solve the first question for you. If you want any…
Q: Find the regression equation, letting the first variable be the predictor (x) variable. Using the…
A: GIven data, X Y X*Y X*X 27 43 1161 729 30 38 1140 900 30 37 1110 900 58 46 2668 3364 34…
Q: The annual profits for a company are given in the following table, where x represents the number of…
A: Given that x represents the number of years since 2007, and y represents the profit in thousands of…
Q: Use a graphing calculator to find a linear regression model for the men's 100-meter freestyle data…
A: Solution: from the data finding linear regression model for both men and women we are using a…
Q: while in high school, Clayton started his T-shirt printing business. The table shows the number of…
A: While in high school, Clayton started his T-shirt printing business. The table below shows the…
Q: Find the regression equation, letting the first variable be the predictor (x) variable. Using the…
A: Given data, X Y X*Y X*X 27 45 1215 729 29 36 1044 841 28 40 1120 784 58 46 2668 3364 33…
Q: Find the regression equation, letting the first variable be the predictor (x) variable. Using the…
A: According to the question, the independent variable is the best actress age (x) and the dependent…
Q: Find the regression equation, letting the first variable be the predictor (x) variable. Using the…
A: Use EXCEL to determine the regression equation. EXCEL procedure: Go to EXCEL Go to Data>Data…
Q: Find the regression equation, letting the first variable be the predictor (x) variable. Using the…
A: In this case the independent variable is the best actress age (x) and the dependent variable is the…
Q: Find the regression equation, letting the first variable be the predictor (x) variable. Using the…
A: Given data :
Q: Find the regression equation, letting the first variable be the predictor (x) variable. Using the…
A: Equation of the regression line: The equation of the regression line is obtained below. From the…
Q: ... 96 99 81 47 71 78 72 34 50 66 94 85 77 82 99 99 67 68 The grades of a sample of 9 students on a…
A:
Q: (а) y 90 54 50 53 80 91 35 41 60 48 35 61 60 71 40 56 60 71 55 68 40 47 65 36 55 53 35 11 50 68 60…
A: Note: Hi, thank you for the question. As per our company guideline we are supposed to answer only…
Q: The grades of a class of 9 students on a midterm report (x) and on the final examination (y) are as…
A: (a). Let X denote the Mid term report Let Y denote the final examination Calculation :…
Q: X - Bill ($) Y - Tip ($) 33.46 50.68 87.92 98.84 63.60 107.34 5.50 5.00 8.08 17.00 12.00 16.00 •…
A: Given: x-Bill y-Tip 33.46 5.5 50.68 5 87.92 8.08 98.84 17 63.6 12 107.34 16
Q: Find the regression equation, letting the first variable be the predictor (x) variable. Using the…
A: Regression: The regression analysis is conducted here by using EXCEL. The software procedure is…
Q: Find the regression equation, letting the first variable be the predictor (X) variable. Using the…
A: The independent variable is Best Actress. The dependent variable is Best Actor. This is simple…
Q: Find the regression equation, letting the first variable be the predictor (x) variable. Using the…
A: Use EXCEL to determine the regression equation. EXCEL procedure: Go to EXCEL Go to Data>Data…
Q: Find the regression equation, letting the first variable be the predictor (x) variable. Using the…
A: In this case the variable “Best Actor” (y) is the dependent variable and the “”Best Actress” (x) is…
Q: Find the regression equation, letting the first variable be the predictor(x) variable. Using the…
A: Given data of ages of best actors and best actress as shown below.Using Data analysis in Excel and…
Q: Find the regression equation, letting the first variable be the predictor (x) variable. Using the…
A: We perform regression using step by step procedure in excel as below: Enter the data into excel…
Q: Find the regression equation, letting the first variable be the predictor (x) variable. Using the…
A:
Q: Find the regression equation, letting the first variable be the predictor (x) variable. Using the…
A: Given Data : X = Age of Best Actress winner Y = Age of best actor winner 27 41 32 38 30 39…
Q: Find the regression equation, letting the first variable be the predictor (x) variable. Using the…
A: The question is about regression Given : To find : 1 ) Reg. eq. 2 ) pred. age best actor given…
Q: Find the regression equation, letting the first variable be the predictor (x) variable. Using the…
A: Regression: In order to obtain the equation of the regression line, first perform regression…
Q: Find the regression equation, letting the first variable be the predictor (x) variable. Using the…
A: In multiple linear regression, there will be more than one independent variable. In simple linear…
Q: table below shows the number of hours ten students spent studying for a test and thei es. Hours…
A: The simple linear regression is of the following format y=a+bx The intercept of the regression…
Q: Find the regression equation, letting the first variable be the predictor (x) variable. Using the…
A: The linear regression is a linear approach for modelling the relationship between a scalar response…
Q: 29. An instructor measured quiz scores and the number of hours studying among a sample 20 college…
A: We want to find regression equation
Q: In a regression analysis, if r2 = 1, then _____. a. SSR = SSE b. SSE = 1…
A: From the provided information,
Q: Find the regression equation, letting the first variable be the predictor (x) variable. Using the…
A: Given - The data value x and y are given ∑x =472 ∑y= 544 n= 12 ∑x2 = 20870 ∑y2 =…
Q: Find the regression equation, letting the first variable be the predictor (x) variable. Using the…
A: The regression equation is, y = 16.632 +( -0.002580*x )
Q: 96 99 81 47 71 78 72 34 50 66 94 85 77 82 99 99 67 68 The grades of a sample of 9 students on a…
A: Calculate Fitting a straight line(Regression line) - Curve fitting using Least square method X Y…
Q: Find the regression equation, letting the first variable be the predictor (x) variable. Using the…
A:
Q: Find the regression equation, letting the first variable be the predictor (x) variable. Using the…
A: In this case, the best actor age (in years) is predicted on the basis of the best actress age (in…
Q: Find the regression equation, letting the first variable be the predictor (x) variable. Using the…
A: Given data, Best Actress Best Actor 27 45 30 37 28 37 61 46 30…
Q: Find the regression equation, letting the first variable be the predictor (x) variable. Using the…
A: Given observation and calculation is shown below Best Actress(x) Best Actor(y) y2 xy 27 43…
Q: Find the regression equation, letting the first variable be the predictor (x) variable. Using the…
A: Therefore, the regression equation is: \hat Y = 51.1163 - 0.1465 Best Actressy^=51.1−0.147*x
Q: b) A study is conducted to determine the relationship between a driver's age and the number of…
A: Given,
Q: Find the regression equation, letting the first variable be the predictor (x) variable. Using the…
A: Hey, since there is multiple sub part questions posted, we will answer first three subpart…
Q: Find the regression equation, letting the first variable be the predictor (x) variable. Using the…
A: Given,
Q: Grades on Midterm Grades on Final 79 84 64 76 76 83 85 91 70 75 86 79 60 79…
A: The simple regression equation is the mathematical straight line form as shown below…

Step by step
Solved in 2 steps

- The grades of a sample of 9 students on a prelim exam (x) and on the midterm exam (y) are shown below. Find the regression equation. y = 34.661 + 0.433x y = 0.777 + 12.0623x y = 12.0623 + 0.777x y = 34.661 - 0.433xThe prelim grades (x) and midterm grades (y) of a sample of 10 MMW students is modeled by the regression line y = 12.0623 + 0.7771x. Estimate the prelim grade if the midterm grade is 83.The number of initial public offerings of stock issued in a 10-year period and the total proceeds of these offerings (in millions) are shown in the table. The equation of the regression line is y=47.271x+18,712.47. Issues, x Proceeds, y425 18,758468 29,602678 43,797478 31,661485 65,518396 65,33069 21,42764 11,847181 32,392157 27,561 Complete parts a and b. The number of initial public offerings of stock issued in a 10-year period and the total proceeds of these offerings (in millions) are shown in the table. The equation of the regression line is y=47.271x+18,712.47. Complete parts a and b. (a) Find the coefficient of determination and interpret the result. (Round to three decimal places as needed.) (b) Find the standard error of estimate se and interpret the result. (Round to three decimal places as needed.)
- The number of initial public offerings of stock issued in a 10-year period and the total proceeds of these offerings (in millions) are shown in the table. Construct and interpret a 95% prediction interval for the proceeds when the number of issues is 569.The equation of the regression line is y=32.409x+17,285.501. Issues, x 410 467 679 499 497 394 62 53 189 174 Proceeds, y 18,223 28,066 43,757 31,337 35,488 35,312 22,180 10,660 30,384 28,416 Construct and interpret a 95% prediction interval for the proceeds when the number of issues is 569. Select the correct choice below and fill in the answer boxes to complete your choice. (Round to the nearest million dollars as needed. Type your answer in standard form where "3.12 million" means 3,120,000.) A. There is a 95% chance that the predicted proceeds given 569 issues is between $____ and $____. B. We can be 95% confident…The number of initial public offerings of stock issued in a 10-year period and the total proceeds of these offerings (in millions) are shown in the table. Construct and interpret a 95% prediction interval for the proceeds when the number of issues is 646. The equation of the regression line is y=32.824x+17,659.242. Issues, x 418 475 683 477 492 379 59 51 196 154 Proceeds, y 17,703 28,601 43,966 31,686 36,833 36,916 21,908 10,311 31,407 28,337 Construct and interpret a 95% prediction interval for the proceeds when the number of issues is 646. Select the correct choice below and fill in the answer boxes to complete your choice. (Round to the nearest million dollars as needed. Type your answer in standard form where "3.12 million" means 3,120,000.) A. We can be 95% confident that when there are 646 issues, the proceeds will be between $____ and $____. B. There is a 95% chance…The grades of a sample of 9 students on a prelim exam (x) and on the midterm exam (y) are shown in the excel worksheet. Find the regression equation
- The quadratic regression equation shown below is for a sample of n=22. Determine the critical value(s).(b)A random sample of twelve students were chosen, and their midterm test score ( y), assignment score (x1), and missed classes (x2) were recorded as follows: Midterm Score, y Assignment Score, x1 Classes Missed, x2 85 65 1 + Ω 74 50 7 76 55 5 90 65 2 85 55 6 87 70 3 94 65 2 98 70 5 81 55 4 91 70 3 76 50 1 74 55 4 (i)What is the fitted multiple linear regression equation of the form ˆy = b0 + b1x1 + b2x2? (ii)From part 6(b)(i) above, estimate the midterm test score grade for a student who has an assignment score of 60 and missed 4 classes. (iii)Assume that the data on ( y, x1, x2) above in 6(b) is inputted into SPSS, with the following results: ANOVA Source SS df MS F…(b)A random sample of twelve students were chosen, and their midterm test score ( y), assignment score (x1), and missed classes (x2) were recorded as follows: Midterm Score, y Assignment Score, x1 Classes Missed, x2 85 65 1 + Ω 74 50 7 76 55 5 90 65 2 85 55 6 87 70 3 94 65 2 98 70 5 81 55 4 91 70 3 76 50 1 74 55 4 (i)What is the fitted multiple linear regression equation of the form ˆy = b0 + b1x1 + b2x2? (ii)From part 6(b)(i) above, estimate the midterm test score grade for a student who has an assignment score of 60 and missed 4 classes. (iii)Assume that the data on ( y, x1, x2) above in 6(b) is inputted into SPSS, with the following results: ANOVA Source SS df MS F…
- (b)A random sample of twelve students were chosen, and their midterm test score ( y), assignment score (x1), and missed classes (x2) were recorded as follows: Midterm Score, y Assignment Score, x1 Classes Missed, x2 85 65 8 74 50 7 76 55 5 90 65 2 85 55 6 87 70 3 94 65 2 98 70 5 81 55 4 91 70 3 76 50 1 74 55 4 (i)What is the fitted multiple linear regression equation of the form ˆy = b0 + b1x1 + b2x2? (ii)From part 6(b)(i) above, estimate the midterm test score grade for a student who has an assignment score of 60 and missed 4 classes. (iii)Assume that the data on ( y, x1, x2) above in 6(b) is inputted into SPSS, with the following results: ANOVA Source SS df MS F…(b)A random sample of twelve students were chosen, and their midterm test score ( y), assignment score (x1), and missed classes (x2) were recorded as follows: Midterm Score, y Assignment Score, x1 Classes Missed, x2 85 65 8 74 50 7 76 55 5 90 65 2 85 55 6 87 70 3 94 65 2 98 70 5 81 55 4 91 70 3 76 50 1 74 55 4 (i)What is the fitted multiple linear regression equation of the form ˆy = b0 + b1x1 + b2x2? (ii)From part 6(b)(i) above, estimate the midterm test score grade for a student who has an assignment score of 60 and missed 4 classes. (iii)Assume that the data on ( y, x1, x2) above in 6(b) is inputted into SPSS, with the following results: ANOVA Source SS df MS F…A random sample of twelve students were chosen, and their midterm test score (y), as- signment score (x1), and missed classes (x2) were recorded as follows: Midterm Score, y Assignment Score, x1 Classes Missed, x2 85 74 76 90 85 87 94 98 81 91 76 74 65 50 55 65 55 70 65 70 55 70 50 55 5 7 5 2 6 3 2 5 4 3 1 4 (i) What is the fitted multiple linear regression equation of the form yˆ = b0 + b1x1 + b2x2? (ii) From part (i) above, estimate the midterm test score grade for a student who has an assignment score of 60 and missed 4 classes.