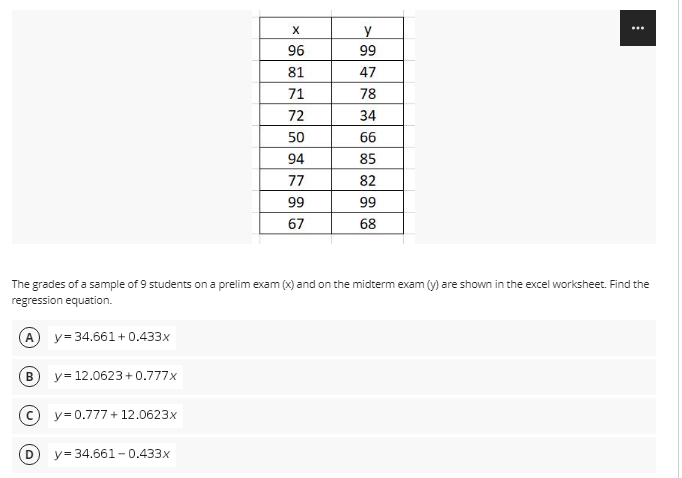
... 96 99 81 47 71 78 72 34 50 66 94 85 77 82 99 99 67 68 The grades of a sample of 9 students on a prelim exam (x) and on the midterm exam (y) are shown in the excel worksheet. Find the regression equation. A y= 34.661 + 0.433x В y= 12.0623+0.777x y= 0.777 + 12.0623x y= 34.661- 0.433x


Q: The following table gives the ages and blood pressure of 9 women. Age (X) : 56 42 36 47 49 42 60 72…
A: From given data, X Y X*Y X*X Y*Y 56 147 8232 3136 21609 42 125 5250 1764 15625 36 118 4248…
Q: The following table displays the mathematics test scores for a random sample of college students,…
A:
Q: Compute the values b0 and b1 of the estimated costs. Interpret the estimated relationship between…
A: 1) We can compute b1 (slope) by using the given formula. b1=∑i=1n(xi-x)(yi-y)∑i=1n(xi-x)2 Therefore,…
Q: Suppose we have the following dataset with one response to variable y and two predictor variables x,…
A: The dependent variable Y and two independent variables X1 and X2 are given as: y x1 x2 140 60…
Q: The data below are the final exam scores of 10 randomly selected statistics students and the number…
A:
Q: (b)A random sample of twelve students were chosen, and their midterm test score ( y), assignment…
A: i) From the given output, the multiple regression equation is, ˆy = 27.547+ 0.922x1 + 0.284x2 ii)…
Q: 1. The grades of a class of 9 students on a midterm report (x) and on the final examination (y) are…
A: Note- Since you have posted multiple questions, as per our guidelines we are supposed to answer only…
Q: 15. Given the data on the problem solving performance of a first year college student and their…
A:
Q: (b)A random sample of twelve students were chosen, and their midterm test score ( y), assignment…
A: Note: Since you have posted a question with multiple subparts, we will solve the first three…
Q: The table below shows the average temperature in New York City (NYC), measured in degrees Fahrenheit…
A:
Q: A random sample of twelve students were chosen, and their midterm test score (y), as- signment score…
A: Given, Midterm Score, y Assignment Score, x1 Classes Missed, x2 85 74 76 90 85 87 94 98…
Q: The number of initial public offeringe of stock issued in a 10-year period and the total proceeds of…
A: The regression equation is given as : y^=32.641x +17627.405 The prediction interval is the…
Q: (b)A random sample of twelve students were chosen, and their midterm test score ( y), assignment…
A: b (i) Step-by-step procedure to find the regression equation using Excel: In Excel sheet, enter…
Q: Do students with higher college grade point averages (GPAs) earn more than those graduates with…
A: Given data : GPA Salary ($) 2.22 72,000 2.29 48,000 2.57 72,000 2.59 64,000 2.77 88,000…
Q: The following table shows the annual number of PhD graduates in a country in various fields.…
A: Excel output:
Q: The following table shows the annual family income of the students enrolled in the JRMSU-TC and…
A: Solution-: Let, X=Annual family income (Pesos) (in '000) and Y=General weighted average (%) We have…
Q: In an attempt to assess the effect of the student's score in the admission test to their academic…
A: The provided information is Sore in admission test x Grade y xy x2 52 80 4160 2704 61 78…
Q: In a population of snakes, researchers caught and measured ten adult females. Their body lengths (X)…
A: Hello! As you have posted more than 3 sub parts, we are answering the first 3 sub-parts. In case…
Q: 1. The table below is about the academic performance in Mathematics of 10 students. Make a simple…
A:
Q: Consider a marketer who develops a simple regression model to explain the costs of flighting (Y) by…
A: 1. 95% confidence interval for β1: Excel Procedure: Enter X and Y in Excel>Data>Data…
Q: Eight students are selected randomly, and their present graduate GPA is compared to thei…
A: For the given data has to find ( a) Regression equation ( b ) Hypothesis test for Regression
Q: The table below shows the average temperature in New York City (NYC), measured in degrees Fahrenheit…
A: Concept: We have given the temperature with respect to the months That is for each month the degree…
Q: The following table displays the mathematics test scores for a random sample of college students,…
A:
Q: The managing director of a company wants to find whether there is a relationship between units of a…
A: Ans . ( i ) X Y X-Mx Y-My (X - Mx)2 (Y - My)2 (X - Mx)(Y - My) 23581110121517182024…
Q: 00 00 30 40 50 60 samp_reg$Age 00 8 20 30 40 50 60 samp_reg$Age resid(test) samp_reg$In_Income -0.5…
A: The conditions for the validity of a regression analysis are that the the error are normally…
Q: 6) Consider the following problem. Student Test Score IQ Gender 1 93 125 Male 2 86 120 Female 3 96…
A: Given: y x1 x2 93 125 Male 86 120 Female 96 115 Male 81 110 Female 92 105 Male 75…
Q: 34 The data given in the table below show some of the results of a study comparing the height of a…
A: 34. Step-by-step procedure to find the regression equation using Excel: In Excel sheet, enter Mass…
Q: The table below gives the estimated world population (in billions) for various years. 1980 1990 1997…
A: x y X - Mx Y - My (X - Mx)2 (X - Mx)(Y - My) 198019901997200020052011…
Q: The following table shows the age (X) and blood pressure (Y) of 8 persons : X: 52 63 45 36 72 65 47…
A:
Q: 1.) The table below is about the academic performance in Mathematics of 10 students. Make a simple…
A: The regression analysis is conducted here by using EXCEL. The software procedure is given below:…
Q: after Decrease in Utilization of Hormone Replacement Therapy." The authors of the paper used a…
A:
Q: The grades of a class of 9 students on a midterm report (x) and on the final examination (y) are as…
A: Note: Hi there! Thank you for posting the question. As there are multiple sub parts, according to…
Q: The following table shows the annual number of PhD graduates in a country in various fields.…
A: Step-by-step procedure to find the regression equation using Excel: In Excel sheet, enter Year in…
Q: The following table shows the annual number of PhD graduates in a country in various fields. Natural…
A:
Q: y 96 99 81 47 71 78 72 34 50 66 94 85 77 82 99 99 67 68
A:
Q: The following table gives the yearly income (in thousands of dollars) of a large corporation for the…
A:
Q: 2.) The table below is about the academic performance in Mathematics of 10 students. Make a multiple…
A: Step-by-step procedure to find the regression line using Excel: In Excel sheet, enter x1, x2 and y…
Q: The annual consumer expenditures and annual net incomes of a sample of 7 families in Cambodia in…
A: Solution : Given data is Family Net Income (x) Expenditure (y) A 6 15 B 15 7 C 3 18 D 16…
Q: The following table shows the approximate number of wireless telephone subscriptions in recent…
A: The following table shows the approximate number of wireless telephone subscriptions in recent…
Q: The number initial public offerings of stock issued in a 10-year period and the total proceeds of…
A: How can the coefficient of determination be interpreted?
Q: A statistical program is recommended. Consider the following data for two variables, x and y. x 22…
A: To obtain linear regression R-software is used.
Q: sixth-grade teacher believes that there is a relationship between his students’ IQ scores (y) and…
A:
Q: The prelim grades (x) and midterm grades (y) of a sample of 10 MMW students is modeled by the…
A: Solution
Q: 4) The data below are the number of absences and the final grades of 9 randomly selected students…
A: Given data: Number of absences 0 3 6 4 9 2 15 8 5 Final grade 98 86 80 82 71 92 55 76 82
Q: The systolic blood pressure of individuals is thought to be related to both age and weight. For a…
A: We can conduct a multiple regression analysis with the help of excel itself use the same regression…
Q: The following table gives information on the amount of sugar (in grams) and the calorie count in one…
A: The data gives information on the amount of sugar (grams) and the calorie count in one serving of a…
Q: The following table lists the midterm and final exam scores for seven students in a statistics…
A: In this case, final exam scores is predicted on the basis of midterm exam scores. The final exam…
Q: The following table displays the mathematics test scores for a random sample of college students,…
A: Given data : Sr. No. Mathematics test(x) SY16C grades(y) 1 39 65 2 43 78 3 21…
Q: Eight students are selected randomly, and their present graduate GPA is compared to their…
A: Introduction: Denote the response variable, Present GPA as y, and the explanatory variables, Undergr…
Q: (b)A random sample of twelve students were chosen, and their midterm test score ( y), assignment…
A: Given: y x1 x2 85 65 8 74 50 7 76 55 5 90 65 2 85 55 6 87 70 3 94 65 2 98 70 5…

Step by step
Solved in 2 steps with 4 images

- The prelim grades (x) and midterm grades (y) of a sample of 10 MMW students is modeled by the regression line y = 12.0623 + 0.7771x. Estimate the prelim grade if the midterm grade is 83.The grades of a sample of 9 students on a prelim exam (x) and on the midterm exam (y) are shown below. Find the regression equation. y = 34.661 + 0.433x y = 0.777 + 12.0623x y = 12.0623 + 0.777x y = 34.661 - 0.433xAccountants at the Tucson firm, Larry Youdelman,CPAs, believed that several traveling executives were submittingunusually high travel vouchers when they returned from businesstrips. First, they took a sample of 200 vouchers submitted from the past year. Then they developed the following multiple-regres-sion equation relating expected travel cost to number of days on the road ( x1 ) and distance traveled ( x2 ) in miles:yn = +90.00 + +48.50x1 + +.40x2The coefficient of correlation computed was .68.a) If Donna Battista returns from a 300-mile trip that took herout of town for 5 days, what is the expected amount she shouldclaim as expenses?b) Battista submitted a reimbursement request for $685. Whatshould the accountant do?c) Should any other variables be included? Which ones? Why?
- The number of initial public offerings of stock issued in a 10-year period and the total proceeds of these offerings (in millions) are shown in the table. The equation of the regression line is y=47.271x+18,712.47. Issues, x Proceeds, y425 18,758468 29,602678 43,797478 31,661485 65,518396 65,33069 21,42764 11,847181 32,392157 27,561 Complete parts a and b. The number of initial public offerings of stock issued in a 10-year period and the total proceeds of these offerings (in millions) are shown in the table. The equation of the regression line is y=47.271x+18,712.47. Complete parts a and b. (a) Find the coefficient of determination and interpret the result. (Round to three decimal places as needed.) (b) Find the standard error of estimate se and interpret the result. (Round to three decimal places as needed.)The grades of a sample of 9 students on a prelim exam (x) and on the midterm exam (y) are shown in the excel worksheet. Find the regression equationThe number of initial public offerings of stock issued in a 10-year period and the total proceeds of these offerings (in millions) are shown in the table. Construct and interpret a 95% prediction interval for the proceeds when the number of issues is 569.The equation of the regression line is y=32.409x+17,285.501. Issues, x 410 467 679 499 497 394 62 53 189 174 Proceeds, y 18,223 28,066 43,757 31,337 35,488 35,312 22,180 10,660 30,384 28,416 Construct and interpret a 95% prediction interval for the proceeds when the number of issues is 569. Select the correct choice below and fill in the answer boxes to complete your choice. (Round to the nearest million dollars as needed. Type your answer in standard form where "3.12 million" means 3,120,000.) A. There is a 95% chance that the predicted proceeds given 569 issues is between $____ and $____. B. We can be 95% confident…
- 6. You estimated a regression with the following output. Source | SS df MS Number of obs = 494 -------------+---------------------------------- F(1, 492) = 38566.69 Model | 803403712 1 803403712 Prob > F = 0.0000 Residual | 10249120.6 492 20831.546 R-squared = 0.9874 -------------+---------------------------------- Adj R-squared = 0.9874 Total | 813652832 493 1650411.42 Root MSE = 144.33 ------------------------------------------------------------------------------ Y | Coef. Std. Err. t P>|t| [95% Conf. Interval] -------------+---------------------------------------------------------------- X | 23.00296 .1171325 196.38 0.000 22.77281 23.2331 _cons | 34.71944 13.12788 2.64 0.008 8.925808 60.51307…X” denote the number of children ever born to a woman, and let “Y” denote years ofeducation for the woman. A simple model relating fertility to years of education is X = β0 + β1Y + u where u is the unobserved error. (i) What kind of factors are contained in u? Are these likely to be correlated with level of education?The quadratic regression equation shown below is for a sample of n=22. Determine the critical value(s).
- The number of initial public offerings of stock issued in a 10-year period and the total proceeds of these offerings (in millions) are shown in the table. Construct and interpret a 95% prediction interval for the proceeds when the number of issues is 646. The equation of the regression line is y=32.824x+17,659.242. Issues, x 418 475 683 477 492 379 59 51 196 154 Proceeds, y 17,703 28,601 43,966 31,686 36,833 36,916 21,908 10,311 31,407 28,337 Construct and interpret a 95% prediction interval for the proceeds when the number of issues is 646. Select the correct choice below and fill in the answer boxes to complete your choice. (Round to the nearest million dollars as needed. Type your answer in standard form where "3.12 million" means 3,120,000.) A. We can be 95% confident that when there are 646 issues, the proceeds will be between $____ and $____. B. There is a 95% chance…A regression between foot length(response variable in cm) and height (eexplanatory variable in inches) for 33 students resulted in the following regression equation: y^=10,9+0,23X one student in the sample was 73 inches tall with a foot length of 29cm.What is the predicted foot length for A)33cm B)17,57cm C)27,69cm D)29cmA student used multiple regression analysis to study how family spending (y) is influenced by income(x1), family size (x2), and additionsto savings(x3). The variables y, x1, and x3 are measured in thousandsof dollars. The following results were obtained.ANOVAdf SSRegression 3 45.9634Residual 11 2.6218TotalCoefficients Standard ErrorIntercept 0.0136x10.7992 0.074x20.2280 0.190x3-0.5796 0.920 Carry out a test to see if x3 and y are significantly related. Use a 5% level of significance.