7.3146 A study compared three display panels used by air traffic controllers. Each display panel was tested for four different simulated emergency conditions. Twenty-four highly trained air traffic controllers were used in the study. Two controllers were randomly assigned to each display panel-emergency condition combination. The time (in seconds) required to stabilize the emergency condition was recorded. The following table gives the resulting data and the JMP output of a two-way ANOVA of the data. Emergency Condition 2 Display Panel 4 17 14 15 12 21 31 34 20 25 14 24 13 22 31 32 28 37 19 19 10 29 15 24 Least Squares Means Estimates Panel Estimate Condition Entimate 1 17.166667 24.500000 32.166667 13.333333 21.500000 18.250000 25.625000 1 2 4 Analysin of Variance Sum of Mean Source F Ratio Dr 11 12 23 Squares 1482.4583 Square 134.769 Model 32.6713 Error c. Total 49.5000 1531.9583 4.125 Prob > <.0001 F Effect Tests Sun of F Ratio 26.4949 Source Nparm Dr Prob >P Squares 2 2 216. 5833 3 3 1247.4583 6 6 Panel <.0001 Condition Panel* Condition 100.8047 <.0001 16.4167 0.6633 0.6809 Tukey HSD All Pairwise Comparisons Quantile 2.66776, Adjusted DF = 12.0, Adjustment = Tukey Prob> t| Lower 95 Upper 95% Panel -Panel Difference Std Error t Ratio 3.25000 1.015505 -4.12500 1.015505 3.20 -4.06 0.0194 0.5409 5.95912 0.0042 < .0001+ -10.0841 -4.66588 -6.8341 -1.41588 -7.37500 1.015505 -7.26 Tukey HSD All Pairwise Comparisons Quantile 2.9688, Adjusted DF = 12.0, Adjustment = Tukey Condition -Condition Difference Std Error t Ratio Prob>|t| Lower 95 Upper 95 0.0002. -10.0146 <.0001. -18.4812 -11.5188 -3.8521 -7.3333 1.172604 -15.0000 1.172604 3.8333 1.172604 -6.25 -12.79 3.27 4 0.0297 0.3521 -7.6667 1.172604 0.0001. -11.1479 -6.54 9.52 16.06 -4.1854 11.1667 1.172604 18.8333 1.172604 <.0001 7.6054 14.6479 <.0001 15.3521 22.3146 Click here for the Excel Data File (a) Interpret the interaction plot in Figure 12.12. Then test for interaction with a=.05. Panel B requires Ness time F(int)» .6633, p-value= .0809: to stabilize the emergency condition. cannot reject H0, no interaction exists. (b) Test the significance of display panel effects with a= .05. F = 26.4949, p-value = .0001; roject HO (c) Test the significance of emergency condition effects with a =.05. F 100.8047, p-value -.,0001; reject но
7.3146 A study compared three display panels used by air traffic controllers. Each display panel was tested for four different simulated emergency conditions. Twenty-four highly trained air traffic controllers were used in the study. Two controllers were randomly assigned to each display panel-emergency condition combination. The time (in seconds) required to stabilize the emergency condition was recorded. The following table gives the resulting data and the JMP output of a two-way ANOVA of the data. Emergency Condition 2 Display Panel 4 17 14 15 12 21 31 34 20 25 14 24 13 22 31 32 28 37 19 19 10 29 15 24 Least Squares Means Estimates Panel Estimate Condition Entimate 1 17.166667 24.500000 32.166667 13.333333 21.500000 18.250000 25.625000 1 2 4 Analysin of Variance Sum of Mean Source F Ratio Dr 11 12 23 Squares 1482.4583 Square 134.769 Model 32.6713 Error c. Total 49.5000 1531.9583 4.125 Prob > <.0001 F Effect Tests Sun of F Ratio 26.4949 Source Nparm Dr Prob >P Squares 2 2 216. 5833 3 3 1247.4583 6 6 Panel <.0001 Condition Panel* Condition 100.8047 <.0001 16.4167 0.6633 0.6809 Tukey HSD All Pairwise Comparisons Quantile 2.66776, Adjusted DF = 12.0, Adjustment = Tukey Prob> t| Lower 95 Upper 95% Panel -Panel Difference Std Error t Ratio 3.25000 1.015505 -4.12500 1.015505 3.20 -4.06 0.0194 0.5409 5.95912 0.0042 < .0001+ -10.0841 -4.66588 -6.8341 -1.41588 -7.37500 1.015505 -7.26 Tukey HSD All Pairwise Comparisons Quantile 2.9688, Adjusted DF = 12.0, Adjustment = Tukey Condition -Condition Difference Std Error t Ratio Prob>|t| Lower 95 Upper 95 0.0002. -10.0146 <.0001. -18.4812 -11.5188 -3.8521 -7.3333 1.172604 -15.0000 1.172604 3.8333 1.172604 -6.25 -12.79 3.27 4 0.0297 0.3521 -7.6667 1.172604 0.0001. -11.1479 -6.54 9.52 16.06 -4.1854 11.1667 1.172604 18.8333 1.172604 <.0001 7.6054 14.6479 <.0001 15.3521 22.3146 Click here for the Excel Data File (a) Interpret the interaction plot in Figure 12.12. Then test for interaction with a=.05. Panel B requires Ness time F(int)» .6633, p-value= .0809: to stabilize the emergency condition. cannot reject H0, no interaction exists. (b) Test the significance of display panel effects with a= .05. F = 26.4949, p-value = .0001; roject HO (c) Test the significance of emergency condition effects with a =.05. F 100.8047, p-value -.,0001; reject но

MATLAB: An Introduction with Applications
6th Edition
ISBN:9781119256830
Author:Amos Gilat
Publisher:Amos Gilat
Chapter1: Starting With Matlab
Section: Chapter Questions
Problem 1P

Related questions
Question
I really need help with section e line 5 only. The only blank.
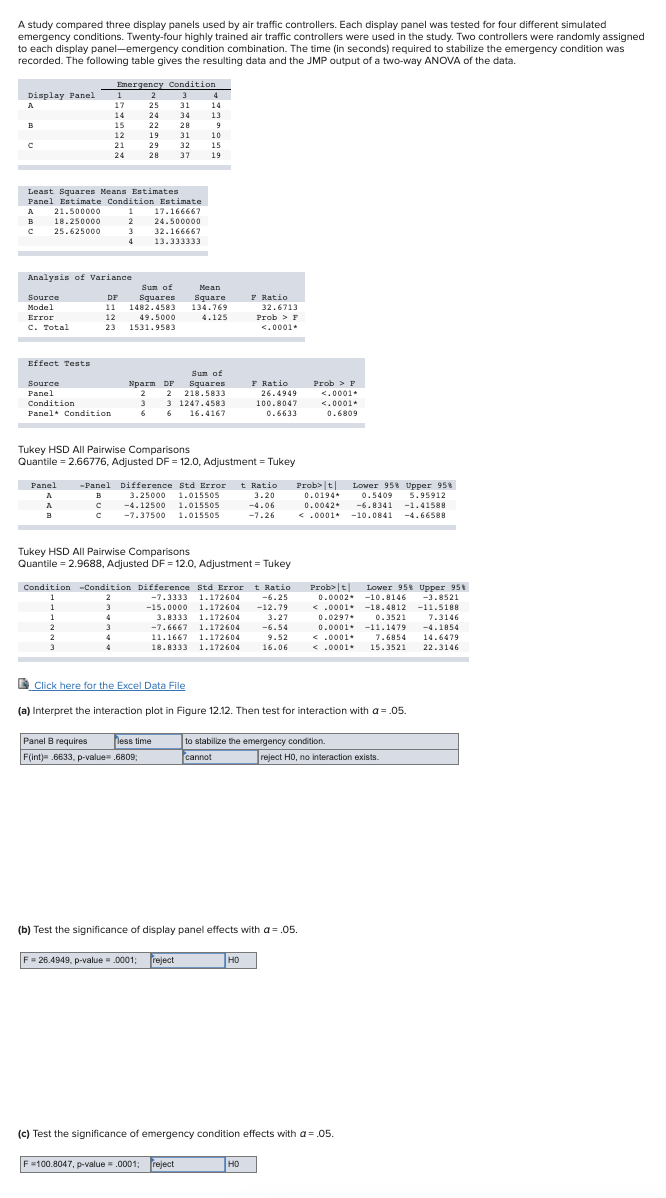
Transcribed Image Text:study compared three display panels used by air traffic controllers. Each display panel was tested for four different simulated
emergency conditions. Twenty-four highly trained air traffic controllers were used in the study. Two controllers were randomly assigned
to each display panel-emergency condition combination. The time (in seconds) required to stabilize the emergency condition was
recorded. The following table gives the resulting data and the JMP output of a two-way ANOVA of the data.
Emergency Condition
2
Display Panel
1
4
17
25
31
14
14
24
34
13
B
15
22
28
9
12
19
31
10
21
29
32
15
24
28
37
19
Least Squares Means Entimates
Panel Estimate Condition Estimate
21.500000
18.250000
1
17.166667
B
2
24.500000
25.625000
32.166667
13.333333
Analysis of Variance
Sun of
Mean
F Ratio
32.6713
Рrob > F
<.0001+
Source
DF
Square
Squares
1482.4583
Model
11
134.769
12
49.5000
1531.9583
Error
4.125
C. Total
23
Effect Tests
Sun of
Nparm DF
2
2
F Ratio
26.4949
100.8047
Source
Prob > F
Squares
218.5833
<.0001+
<.0001
0.6809
Panel
3 3 1247. 4583
16.4167
Condition
Panel Condition
6
6
0.6633
Tukey HSD All Pairwise Comparisons
Quantile = 2.66776, Adjusted DF = 12.0, Adjustment = Tukey
-Panel Difference Std Error t Ratio Prob>|t| Lower 95% Upper 958
5.95912
-1.41588
Panel
0.0194+
0.0042+
B
3.25000 1.015505
3.20
0.5409
-4.12500
1.015505
-4.06
-6.8341
-7.37500
1.015505
-7.26
< .0001*
-10.0841
-4.66588
Tukey HSD All Pairwise Comparisons
Quantile = 2.9688, Adjusted DF = 12.0, Adjustment = Tukey
Condition -Condition Difference Std Error t Ratio
Prob>|t|
Lower 95 Upper 95%
1
2
-7.3333 1.172604
-6.25
0.0002. -10.8146
-3.8521
1
-15.0000
1.172604
-12.79
<.0001.
-18.4812
-11.5188
1
4
3.8333
1.172604
3.27
0.0297.
0.0001.-11.1479
0.3521
7.3146
3
-7.6667
1.172604
-6.54
-4.1854
4
11.1667
1.172604
9.52
<.0001
7.6854
14.6479
18.8333 1.172604
16.06
< .0001
15.3521
22.3146
E Click here for the Excel Data File
(a) Interpret the interaction plot in Figure 12.12. Then test for interaction with a= 05.
Panel B requires
less time
to stabilize the emergency condition.
F(int)= .6633, p-value= .6809;
cannot
reject HO, no interaction exists.
(b) Test the significance of display panel effects with a = .05.
F = 26.4949, p-value = .0001;
reject
HO
но
(c) Test the significance of emergency condition effects with a= .05.
F =100.8047, p-value-.0001; reject
HO
![(d) Make pairwise comparisons of display panels A, B, and Cby using Tukey simultaneous 95 percent confidence intervals.(Round
your answers to 4 decimal places. Negative amounts should be indicated by a minus sign.)
0.5409
5.9591]
(1.4159) ]
(4.6659) )
HA - µB:
(6.8341)
(10.0841).
LA - pC:
pB - uC:
(e) Make pairwise comparisons of emergency conditions 1, 2, 3, and 4 by using Tukey simultaneous 95 percent confidence intervals.
(Round your answers to 4 decimal places. Negative amounts should be indicated by a minus sign.)
u1- u2:
p1- u3:
(3.8521))
(11.5188) ]
7.3146 ]
(4.1854)]
14.6479]
(10.8146)
(18.4812)
p1- p4:
0.3521
u2 - u3:
(11.1479)
u2 - u4:
p3 - u4:
22.3146 ]
15.3521
(f) Which display panel minimizes the time required to stabilize an emergency condition? Does your answer depend on the
emergency condition? Why?
Panel B
No
minimizes the time required to stabilize an emergency condition.
there is
no
interaction.
(g) Calculate a 95 percent (individual) confidence interval for the mean time required to stabilize emergency condition 4 using display
panel B. (Round your answers to 2 decimal places.)
6.37.
12.63 ]
Confidence interval](/v2/_next/image?url=https%3A%2F%2Fcontent.bartleby.com%2Fqna-images%2Fquestion%2Fedd60f12-fe5d-409b-96fb-afd8188a6209%2Ff20782db-820d-479a-9891-72138d40f68b%2Fktwaxb_processed.png&w=3840&q=75)
Transcribed Image Text:(d) Make pairwise comparisons of display panels A, B, and Cby using Tukey simultaneous 95 percent confidence intervals.(Round
your answers to 4 decimal places. Negative amounts should be indicated by a minus sign.)
0.5409
5.9591]
(1.4159) ]
(4.6659) )
HA - µB:
(6.8341)
(10.0841).
LA - pC:
pB - uC:
(e) Make pairwise comparisons of emergency conditions 1, 2, 3, and 4 by using Tukey simultaneous 95 percent confidence intervals.
(Round your answers to 4 decimal places. Negative amounts should be indicated by a minus sign.)
u1- u2:
p1- u3:
(3.8521))
(11.5188) ]
7.3146 ]
(4.1854)]
14.6479]
(10.8146)
(18.4812)
p1- p4:
0.3521
u2 - u3:
(11.1479)
u2 - u4:
p3 - u4:
22.3146 ]
15.3521
(f) Which display panel minimizes the time required to stabilize an emergency condition? Does your answer depend on the
emergency condition? Why?
Panel B
No
minimizes the time required to stabilize an emergency condition.
there is
no
interaction.
(g) Calculate a 95 percent (individual) confidence interval for the mean time required to stabilize emergency condition 4 using display
panel B. (Round your answers to 2 decimal places.)
6.37.
12.63 ]
Confidence interval
Expert Solution
This question has been solved!
Explore an expertly crafted, step-by-step solution for a thorough understanding of key concepts.

This is a popular solution!

Trending now
This is a popular solution!

Step by step
Solved in 2 steps with 2 images

Recommended textbooks for you
MATLAB: An Introduction with Applications
Statistics
ISBN:
9781119256830
Author:
Amos Gilat
Publisher:
John Wiley & Sons Inc

Probability and Statistics for Engineering and th…
Statistics
ISBN:
9781305251809
Author:
Jay L. Devore
Publisher:
Cengage Learning

Statistics for The Behavioral Sciences (MindTap C…
Statistics
ISBN:
9781305504912
Author:
Frederick J Gravetter, Larry B. Wallnau
Publisher:
Cengage Learning
MATLAB: An Introduction with Applications
Statistics
ISBN:
9781119256830
Author:
Amos Gilat
Publisher:
John Wiley & Sons Inc
Probability and Statistics for Engineering and th…
Statistics
ISBN:
9781305251809
Author:
Jay L. Devore
Publisher:
Cengage Learning
Statistics for The Behavioral Sciences (MindTap C…
Statistics
ISBN:
9781305504912
Author:
Frederick J Gravetter, Larry B. Wallnau
Publisher:
Cengage Learning

Elementary Statistics: Picturing the World (7th E…
Statistics
ISBN:
9780134683416
Author:
Ron Larson, Betsy Farber
Publisher:
PEARSON

The Basic Practice of Statistics
Statistics
ISBN:
9781319042578
Author:
David S. Moore, William I. Notz, Michael A. Fligner
Publisher:
W. H. Freeman

Introduction to the Practice of Statistics
Statistics
ISBN:
9781319013387
Author:
David S. Moore, George P. McCabe, Bruce A. Craig
Publisher:
W. H. Freeman