y = l(x) y = h(x) 7 8 10 12 14 16 18 20 The sketch shows the graphs of the functions h and I defined by y = h(x) = log,(x – p) + q and h= (x) = mx + c. The two graphs intersect at the points A and B. (3.1) Use the graph to determine p and q, and hence write down the equation that defines h. (3.2) Write down the sets that represent the domain and the range of the function h, and the equation of the asymptote of the graph of h. (3.3) Describe the steps of the transformation process that you would apply to the graph of h to obtain the graph of y = log, x.
y = l(x) y = h(x) 7 8 10 12 14 16 18 20 The sketch shows the graphs of the functions h and I defined by y = h(x) = log,(x – p) + q and h= (x) = mx + c. The two graphs intersect at the points A and B. (3.1) Use the graph to determine p and q, and hence write down the equation that defines h. (3.2) Write down the sets that represent the domain and the range of the function h, and the equation of the asymptote of the graph of h. (3.3) Describe the steps of the transformation process that you would apply to the graph of h to obtain the graph of y = log, x.

Algebra & Trigonometry with Analytic Geometry
13th Edition
ISBN:9781133382119
Author:Swokowski
Publisher:Swokowski
Chapter5: Inverse, Exponential, And Logarithmic Functions
Section: Chapter Questions
Problem 18T

Related questions

Concept explainers
Rate of Change
The relation between two quantities which displays how much greater one quantity is than another is called ratio.
Slope
The change in the vertical distances is known as the rise and the change in the horizontal distances is known as the run. So, the rise divided by run is nothing but a slope value. It is calculated with simple algebraic equations as:
Question
100%
Transcribed Image Text:y = /(x)
B
9.
y = h(x)
7.
8 10 12 14 16 18 20
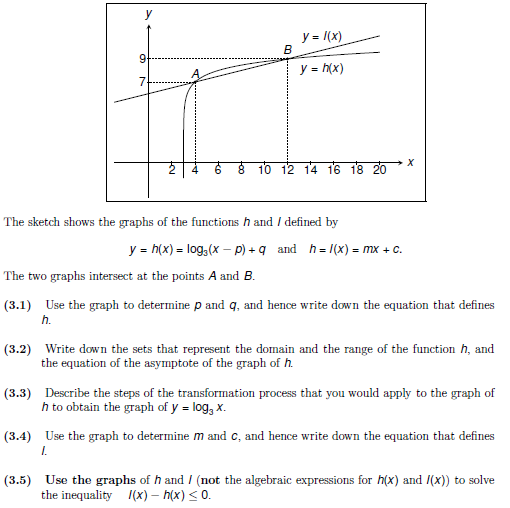
The sketch shows the graphs of the functionsh and I defined by
y = h(x) = log,(x – p) + q_and h= l(x) = mx + C.
The two graphs intersect at the points A and B.
(3.1) Use the graph to determine p and q, and hence write down the equation that defines
h.
(3.2) Write down the sets that represent the domain and the range of the function h, and
the equation of the asymptote of the graph of h.
(3.3) Describe the steps of the transformation process that you would apply to the graph of
h to obtain the graph of y = log, x.
(3.4) Use the graph to determine m and c, and hence write down the equation that defines
I.
(3.5) Use the graphs of h and / (not the algebraic expressions for h(x) and /(x)) to solve
the inequality (x) – h(x) < 0.
Expert Solution
This question has been solved!
Explore an expertly crafted, step-by-step solution for a thorough understanding of key concepts.

Step by step
Solved in 4 steps with 4 images

Knowledge Booster


Learn more about
Need a deep-dive on the concept behind this application? Look no further. Learn more about this topic, algebra and related others by exploring similar questions and additional content below.Recommended textbooks for you
Algebra & Trigonometry with Analytic Geometry
Algebra
ISBN:
9781133382119
Author:
Swokowski
Publisher:
Cengage
Algebra & Trigonometry with Analytic Geometry
Algebra
ISBN:
9781133382119
Author:
Swokowski
Publisher:
Cengage