Year 1940 1950 1960 1970 1980 Rate of change (million people per year) 36 56 77 87 100 The table shows growth rates for a population over time. Use this data to sketch a smooth curve relating the two variables. Draw rectangles on this graph to help you underestimate the total change in the world's population between 1940 and 1980. What underestimate did you obtain? million people Draw rectangles on this graph to help you overestimate the total change in the world's population between 1940 and 1980. What overestimate did you obtain? million people If the population in 1940 were 2958 million and if the population in 1980 were 5901 million, what would be the true total change in population? million people
Year 1940 1950 1960 1970 1980 Rate of change (million people per year) 36 56 77 87 100 The table shows growth rates for a population over time. Use this data to sketch a smooth curve relating the two variables. Draw rectangles on this graph to help you underestimate the total change in the world's population between 1940 and 1980. What underestimate did you obtain? million people Draw rectangles on this graph to help you overestimate the total change in the world's population between 1940 and 1980. What overestimate did you obtain? million people If the population in 1940 were 2958 million and if the population in 1980 were 5901 million, what would be the true total change in population? million people

Big Ideas Math A Bridge To Success Algebra 1: Student Edition 2015
1st Edition
ISBN:9781680331141
Author:HOUGHTON MIFFLIN HARCOURT
Publisher:HOUGHTON MIFFLIN HARCOURT
Chapter8: Graphing Quadratic Functions
Section8.6: Comparing Linear, Exponential, And Quadratic Functions
Problem 32E

Related questions
Question
100%
Transcribed Image Text:Year
1940 1950 1960 1970 1980
Rate of change (million people per year) 36
56
77
87
100
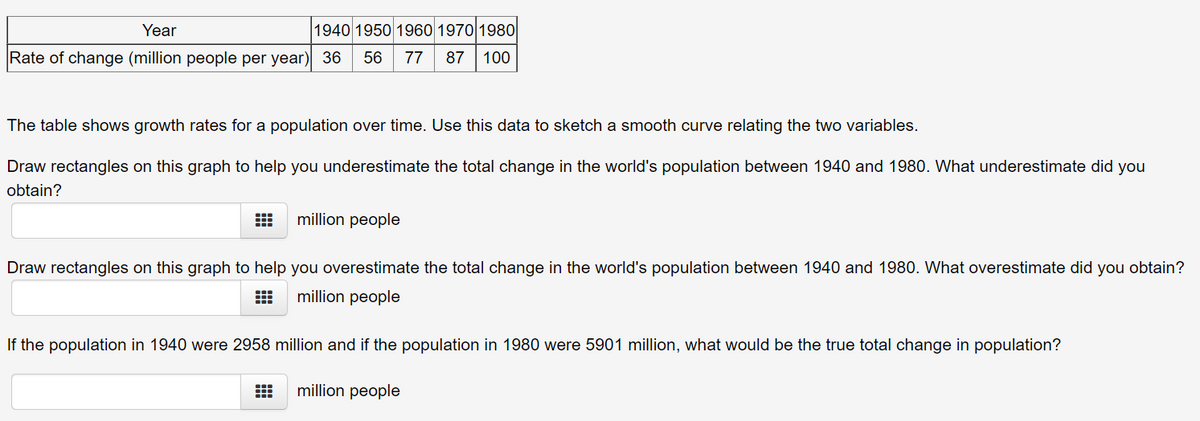
The table shows growth rates for a population over time. Use this data to sketch a smooth curve relating the two variables.
Draw rectangles on this graph to help you underestimate the total change in the world's population between 1940 and 1980. What underestimate did you
obtain?
million people
Draw rectangles on this graph to help you overestimate the total change in the world's population between 1940 and 1980. What overestimate did you obtain?
million people
If the population in 1940 were 2958 million and if the population in 1980 were 5901 million, what would be the true total change in population?
million people
Expert Solution
This question has been solved!
Explore an expertly crafted, step-by-step solution for a thorough understanding of key concepts.

This is a popular solution!

Trending now
This is a popular solution!

Step by step
Solved in 2 steps with 4 images

Recommended textbooks for you
Big Ideas Math A Bridge To Success Algebra 1: Stu…
Algebra
ISBN:
9781680331141
Author:
HOUGHTON MIFFLIN HARCOURT
Publisher:
Houghton Mifflin Harcourt

Glencoe Algebra 1, Student Edition, 9780079039897…
Algebra
ISBN:
9780079039897
Author:
Carter
Publisher:
McGraw Hill

Big Ideas Math A Bridge To Success Algebra 1: Stu…
Algebra
ISBN:
9781680331141
Author:
HOUGHTON MIFFLIN HARCOURT
Publisher:
Houghton Mifflin Harcourt
Glencoe Algebra 1, Student Edition, 9780079039897…
Algebra
ISBN:
9780079039897
Author:
Carter
Publisher:
McGraw Hill

College Algebra (MindTap Course List)
Algebra
ISBN:
9781305652231
Author:
R. David Gustafson, Jeff Hughes
Publisher:
Cengage Learning

Functions and Change: A Modeling Approach to Coll…
Algebra
ISBN:
9781337111348
Author:
Bruce Crauder, Benny Evans, Alan Noell
Publisher:
Cengage Learning

Algebra & Trigonometry with Analytic Geometry
Algebra
ISBN:
9781133382119
Author:
Swokowski
Publisher:
Cengage