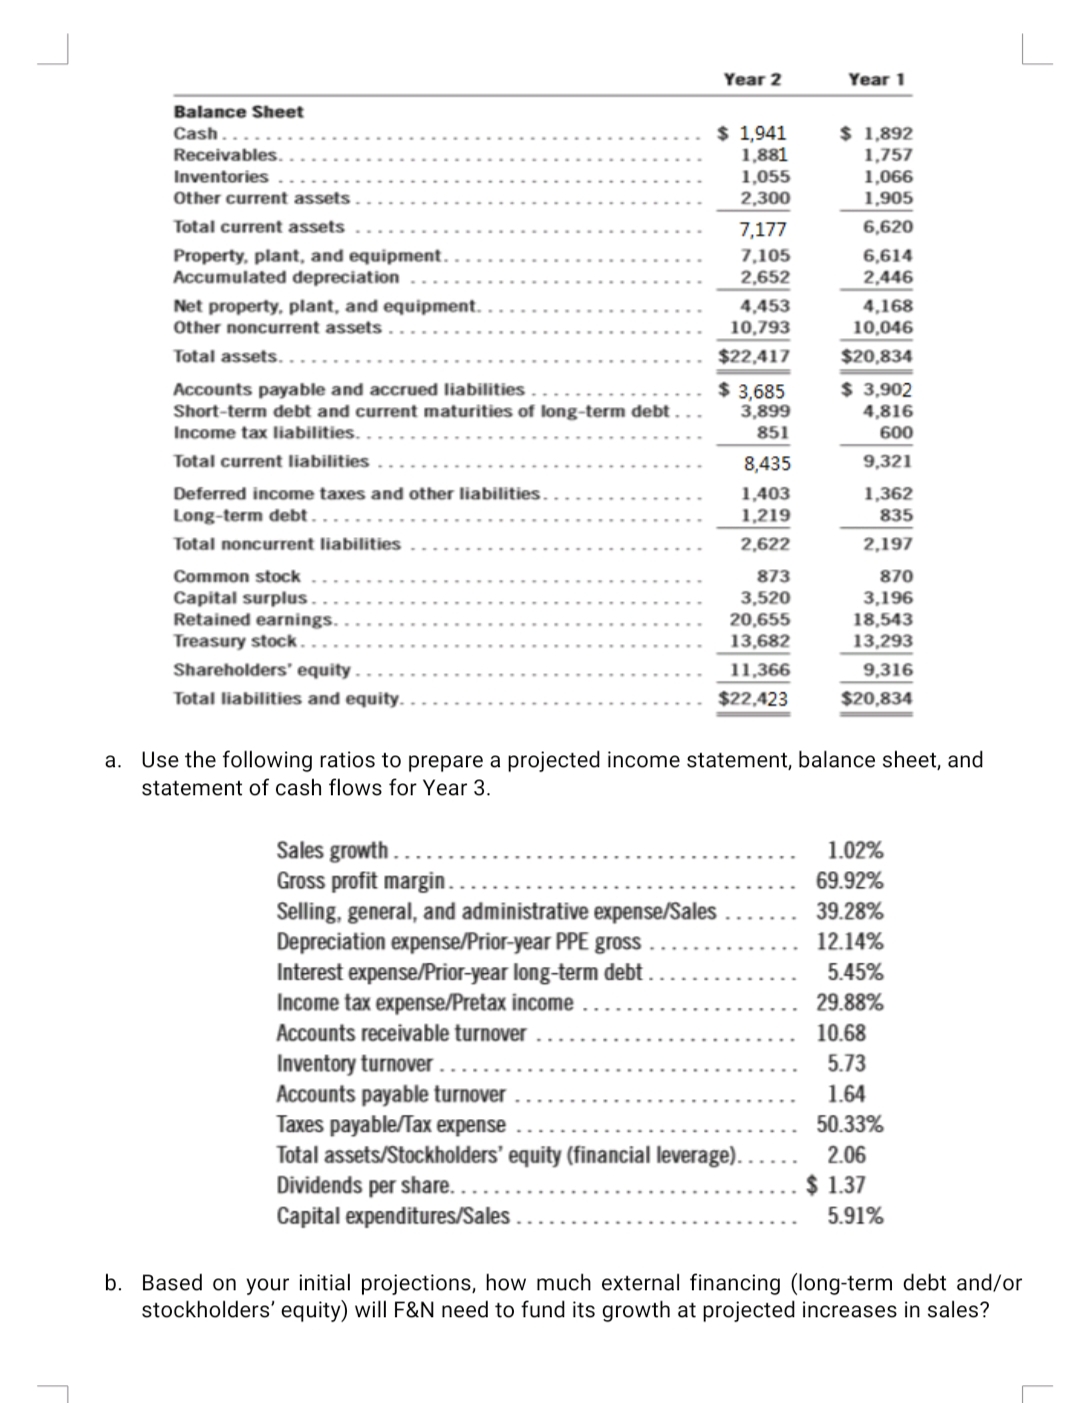
Year 2 Year 1 Balance Sheet $ 1,941 1,881 1,055 2,300 $ 1,892 1,757 1,066 1,905 Cash.. Receivables. Inventories Other current assets Total current assets 7,177 6,620 Property, plant, and equipment.. Accumulated depreciation 7,105 2,652 6,614 2,446 Net property, plant, and equipment. Other noncurrent assets. 4,453 10,793 4,168 10,046 Total assets. $22,417 $20,834 Accounts payable and accrued liabilities Short-term debt and current maturities of long-term debt . $ 3,685 3,899 851 $ 3,902 4,816 600 Income tax liabilities. . Total current liabilities 8,435 9,321 1,403 1,219 Deferred income taxes and other liabilities. 1,362 835 Long-term debt. Total noncurrent liabilities 2,622 2,197 Common stock 873 870 Capital surplus. Retained earnings. 3,520 20,655 13,682 3,196 18,543 13,293 Treasury stock. Shareholders' equity . . 11,366 9,316 Total liabilities and equity. $22,423 $20,834 a. Use the following ratios to prepare a projected income statement, balance sheet, and statement of cash flows for Year 3. Sales growth . . Gross profit margin. Selling, general, and administrative expense/Sales Depreciation expense/Prior-year PPE gross Interest expense/Prior-year long-term debt . Income tax expense/Pretax income Accounts receivable turnover . 1.02% 69.92% 39.28% 12.14% 5.45% 29.88% 10.68 Inventory turnover.. Accounts payable turnover Taxes payable/Tax expense Total assets/Stockholders' equity (financial leverage). Dividends per share. . Capital expenditures/Sales . 5.73 1.64 50.33% 2.06 $ 1.37 5.91% b. Based on your initial projections, how much external financing (long-term debt and/or stockholders' equity) will F&N need to fund its growth at projected increases in sales?
Year 2 Year 1 Balance Sheet $ 1,941 1,881 1,055 2,300 $ 1,892 1,757 1,066 1,905 Cash.. Receivables. Inventories Other current assets Total current assets 7,177 6,620 Property, plant, and equipment.. Accumulated depreciation 7,105 2,652 6,614 2,446 Net property, plant, and equipment. Other noncurrent assets. 4,453 10,793 4,168 10,046 Total assets. $22,417 $20,834 Accounts payable and accrued liabilities Short-term debt and current maturities of long-term debt . $ 3,685 3,899 851 $ 3,902 4,816 600 Income tax liabilities. . Total current liabilities 8,435 9,321 1,403 1,219 Deferred income taxes and other liabilities. 1,362 835 Long-term debt. Total noncurrent liabilities 2,622 2,197 Common stock 873 870 Capital surplus. Retained earnings. 3,520 20,655 13,682 3,196 18,543 13,293 Treasury stock. Shareholders' equity . . 11,366 9,316 Total liabilities and equity. $22,423 $20,834 a. Use the following ratios to prepare a projected income statement, balance sheet, and statement of cash flows for Year 3. Sales growth . . Gross profit margin. Selling, general, and administrative expense/Sales Depreciation expense/Prior-year PPE gross Interest expense/Prior-year long-term debt . Income tax expense/Pretax income Accounts receivable turnover . 1.02% 69.92% 39.28% 12.14% 5.45% 29.88% 10.68 Inventory turnover.. Accounts payable turnover Taxes payable/Tax expense Total assets/Stockholders' equity (financial leverage). Dividends per share. . Capital expenditures/Sales . 5.73 1.64 50.33% 2.06 $ 1.37 5.91% b. Based on your initial projections, how much external financing (long-term debt and/or stockholders' equity) will F&N need to fund its growth at projected increases in sales?

Survey of Accounting (Accounting I)
8th Edition
ISBN:9781305961883
Author:Carl Warren
Publisher:Carl Warren
Chapter9: Metric-analysis Of Financial Statements
Section: Chapter Questions
Problem 9.1E

Related questions
Question
Transcribed Image Text:Year 2
Year 1
Balance Sheet
$ 1,941
1,881
1,055
2,300
Cash.
$ 1,892
1,757
1,066
1,905
Receivables.
Inventories
Other current assets .
Total current assets
7,177
6,620
Property, plant, and equipment. .
Accumulated depreciation
7,105
2,652
6,614
2,446
Net property, plant, and equipment.
Other noncurrent assets .
4,453
10,793
4,168
10,046
Total assets..
$22,417
$20,834
Accounts payable and accrued liabilities
Short-term debt and current maturities of long-term debt .
$ 3,685
3,899
$ 3,902
4,816
Income tax liabilities.
851
600
Total current liabilities
8,435
9,321
1,403
1,219
Deferred income taxes and other liabilities.
1,362
Long-term debt .
835
Total noncurrent liabilities
2,622
2,197
870
3,196
18,543
13,293
Common stock
873
Capital surplus.
Retained earnings.
Treasury stock.
3,520
20,655
13,682
Shareholders' equity .
11,366
9,316
Total liabilities and equity.
$22,423
$20,834
a. Use the following ratios to prepare a projected income statement, balance sheet, and
statement of cash flows for Year 3.
Sales growth . .
Gross profit margin..
Selling, general, and administrative expense/Sales
Depreciation expense/Prior-year PPE gross
Interest expense/Prior-year long-term debt .
Income tax expense/Pretax income
1.02%
69.92%
39.28%
12.14%
5.45%
29.88%
Accounts receivable turnover
10.68
Inventory turnover ....
Accounts payable turnover
Taxes payable/Tax expense
Total assets/Stockholders' equity (financial leverage).
Dividends per share. . .
Capital expenditures/Sales .
5.73
1.64
50.33%
2.06
$ 1.37
5.91%
b. Based on your initial projections, how much external financing (long-term debt and/or
stockholders' equity) will F&N need to fund its growth at projected increases in sales?
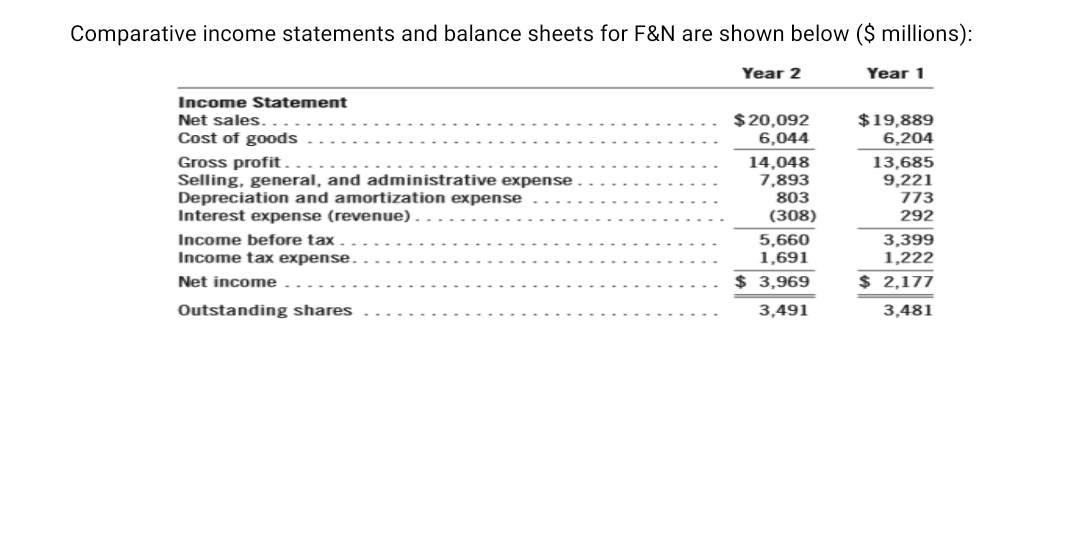
Transcribed Image Text:Comparative income statements and balance sheets for F&N are shown below ($ millions):
Year 2
Year 1
Income Statement
$19,889
6,204
Net sales.
$20,092
6,044
Cost of goods
Gross profit.
Selling, general, and administrative expense
Depreciation and amortization expense
Interest expense (revenue)
14,048
7,893
803
(308)
13,685
9,221
773
292
3,399
1,222
Income before tax
5,660
1,691
Income tax expense.
Net income
$ 3,969
$ 2,177
Outstanding shares
3,491
3,481
Expert Solution
This question has been solved!
Explore an expertly crafted, step-by-step solution for a thorough understanding of key concepts.

This is a popular solution!

Trending now
This is a popular solution!

Step by step
Solved in 2 steps

Knowledge Booster


Learn more about
Need a deep-dive on the concept behind this application? Look no further. Learn more about this topic, accounting and related others by exploring similar questions and additional content below.Recommended textbooks for you
Survey of Accounting (Accounting I)
Accounting
ISBN:
9781305961883
Author:
Carl Warren
Publisher:
Cengage Learning

Managerial Accounting: The Cornerstone of Busines…
Accounting
ISBN:
9781337115773
Author:
Maryanne M. Mowen, Don R. Hansen, Dan L. Heitger
Publisher:
Cengage Learning

Intermediate Accounting: Reporting And Analysis
Accounting
ISBN:
9781337788281
Author:
James M. Wahlen, Jefferson P. Jones, Donald Pagach
Publisher:
Cengage Learning
Survey of Accounting (Accounting I)
Accounting
ISBN:
9781305961883
Author:
Carl Warren
Publisher:
Cengage Learning
Managerial Accounting: The Cornerstone of Busines…
Accounting
ISBN:
9781337115773
Author:
Maryanne M. Mowen, Don R. Hansen, Dan L. Heitger
Publisher:
Cengage Learning
Intermediate Accounting: Reporting And Analysis
Accounting
ISBN:
9781337788281
Author:
James M. Wahlen, Jefferson P. Jones, Donald Pagach
Publisher:
Cengage Learning

Managerial Accounting
Accounting
ISBN:
9781337912020
Author:
Carl Warren, Ph.d. Cma William B. Tayler
Publisher:
South-Western College Pub

Fundamentals of Financial Management (MindTap Cou…
Finance
ISBN:
9781337395250
Author:
Eugene F. Brigham, Joel F. Houston
Publisher:
Cengage Learning