yet a ed P tef 132.00 g on A liquor sample was prepared for GC analysis. 15 mL of n-pentanol was added to a 50 ml volumetric flask and diluted to the mark with the liquor sample. This was labeled as flask A GC spectra of this solution resulted to peak areas of 3284923 for the unknown component and 3672894 for the internal standard (n-pentanol). The unknown component was identified as ethanol and so a standard solution containing 10 m of ethanol and 10 ml. of n- pentanol were added to a 50 ml volumetric flask then diluted to the mark with distilled water; this was labeled as flask B. GC analysis of the solution in flask Bgv peak areas 1173845 and 2874034 for n-pentanol and ethanol respectively. Estimate the amount of ethanol in the liquor sample in % v/v. MV, - M,V, san amount calculated 100 semple weight Nsample Resolution Or Wer A--leg ) N- Or Cencentration reie Signal re fe Concentration rie in comparisn ti ignal r /wcomparnhim
yet a ed P tef 132.00 g on A liquor sample was prepared for GC analysis. 15 mL of n-pentanol was added to a 50 ml volumetric flask and diluted to the mark with the liquor sample. This was labeled as flask A GC spectra of this solution resulted to peak areas of 3284923 for the unknown component and 3672894 for the internal standard (n-pentanol). The unknown component was identified as ethanol and so a standard solution containing 10 m of ethanol and 10 ml. of n- pentanol were added to a 50 ml volumetric flask then diluted to the mark with distilled water; this was labeled as flask B. GC analysis of the solution in flask Bgv peak areas 1173845 and 2874034 for n-pentanol and ethanol respectively. Estimate the amount of ethanol in the liquor sample in % v/v. MV, - M,V, san amount calculated 100 semple weight Nsample Resolution Or Wer A--leg ) N- Or Cencentration reie Signal re fe Concentration rie in comparisn ti ignal r /wcomparnhim

Chapter28: Atomic Spectroscopy
Section: Chapter Questions
Problem 28.13QAP

Related questions
Question
D10)
Transcribed Image Text:N.1
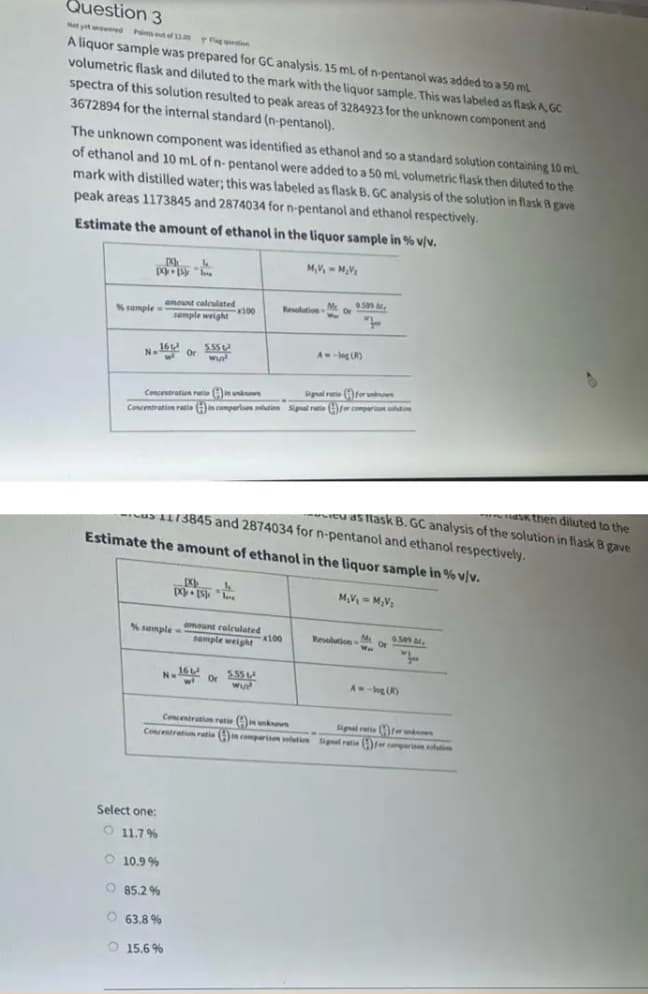
Question 3
Not yet red Pints eut el 1n g
A liquor sample was prepared for GC analysis. 15 mL of n-pentanol was added to a 50 mL
volumetric flask and diluted to the mark with the liquor sample. This was labeled as flask A, GC
spectra of this solution resulted to peak areas of 3284923 for the unknown component and
3672894 for the internal standard (n-pentanol).
The unknown component was identified as ethanol and so a standard solution containing 10 mL
of ethanol and 10 mL of n- pentanol were added to a 50 mL volumetric flask then diluted to the
mark with distilled water; this was labeled as flask B. GC analysis of the solution in flask B gave
peak areas 1173845 and 2874034 for n-pentanol and ethanol respectively.
Estimate the amount of ethanol in the liquor sample in % v/v.
M,V, - M,V
amount calculated
ResolutionM S
Or
Nsample
sample weight 00
16
A--log (R)
N.
Or
Signal retie (Afer non
Concentration retio A unknon
Concentration reie )in comparisen slution Signal retie E)fer comparn shti
aSK then diluted to the
cu as lask B. GC analysis of the solution in flask B gave
sas 1173845 and 2874034 for n-pentanol and ethanol respectively.
Estimate the amount of ethanol in the liquor sample in % v/v.
M,V, - M,V
S sample =
amount calculated
x100
M
Revolution
Or
Wa
se ,
sample weight
N. or
555
A -log()
Concentration ratie ( nkn
Signal ratie fr
Concentratiom ratie (ncperism ltin ignal retie comperise oim
Select one:
O 11.7%
O 10.9 %
O 85.2%
O 63.8 %
O 15.6 %
Expert Solution
This question has been solved!
Explore an expertly crafted, step-by-step solution for a thorough understanding of key concepts.

Step by step
Solved in 3 steps with 3 images

Knowledge Booster


Learn more about
Need a deep-dive on the concept behind this application? Look no further. Learn more about this topic, chemistry and related others by exploring similar questions and additional content below.Recommended textbooks for you

Principles of Instrumental Analysis
Chemistry
ISBN:
9781305577213
Author:
Douglas A. Skoog, F. James Holler, Stanley R. Crouch
Publisher:
Cengage Learning
Principles of Instrumental Analysis
Chemistry
ISBN:
9781305577213
Author:
Douglas A. Skoog, F. James Holler, Stanley R. Crouch
Publisher:
Cengage Learning