Yı = -60 16.2 17.1 16.6 16.3 Y2 = -70 15.1 15.2 15 13.2 14.7 Y3 = -80 16.4 17.3 16.8 17.2 15.3 18.2 The populations are not normally distributed with unequal population variances. Using a suitable non-parametric statistical test, is there enough evidence to reject the hypothesis that all thresholds have the same average coverage probability value? How would you write the hypotheses statement for this problem? What is the suitable statistical distribution to find the critical value at a=0.05?
Yı = -60 16.2 17.1 16.6 16.3 Y2 = -70 15.1 15.2 15 13.2 14.7 Y3 = -80 16.4 17.3 16.8 17.2 15.3 18.2 The populations are not normally distributed with unequal population variances. Using a suitable non-parametric statistical test, is there enough evidence to reject the hypothesis that all thresholds have the same average coverage probability value? How would you write the hypotheses statement for this problem? What is the suitable statistical distribution to find the critical value at a=0.05?

Chapter8: Sequences, Series,and Probability
Section8.7: Probability
Problem 11ECP: A manufacturer has determined that a machine averages one faulty unit for every 500 it produces....

Related questions
Topic Video
Question
Transcribed Image Text:(b)
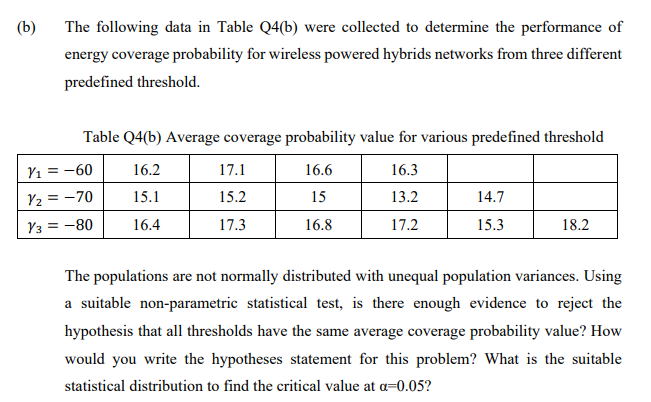
The following data in Table Q4(b) were collected to determine the performance of
energy coverage probability for wireless powered hybrids networks from three different
predefined threshold.
Table Q4(b) Average coverage probability value for various predefined threshold
Yı = -60
16.2
17.1
16.6
16.3
Y2 = -70
15.1
15.2
15
13.2
14.7
Yз—80
16.4
17.3
16.8
17.2
15.3
18.2
The populations are not normally distributed with unequal population variances. Using
a suitable non-parametric statistical test, is there enough evidence to reject the
hypothesis that all thresholds have the same average coverage probability value? How
would you write the hypotheses statement for this problem? What is the suitable
statistical distribution to find the critical value at a=0.05?
Expert Solution
This question has been solved!
Explore an expertly crafted, step-by-step solution for a thorough understanding of key concepts.

Step by step
Solved in 2 steps

Knowledge Booster


Learn more about
Need a deep-dive on the concept behind this application? Look no further. Learn more about this topic, statistics and related others by exploring similar questions and additional content below.Recommended textbooks for you

Algebra & Trigonometry with Analytic Geometry
Algebra
ISBN:
9781133382119
Author:
Swokowski
Publisher:
Cengage
Algebra & Trigonometry with Analytic Geometry
Algebra
ISBN:
9781133382119
Author:
Swokowski
Publisher:
Cengage