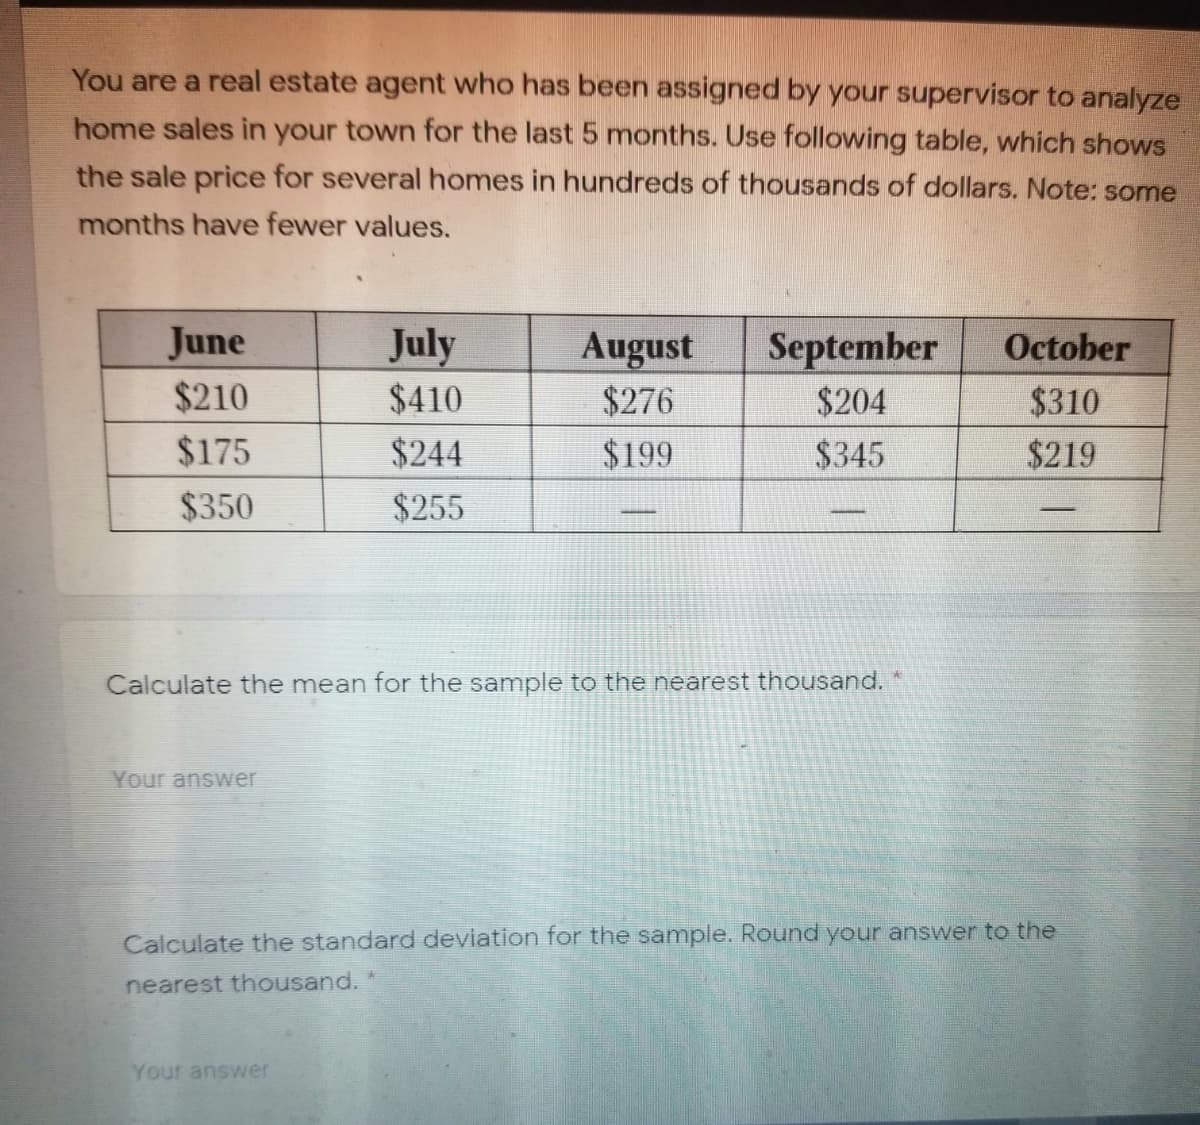
You are a real estate agent who has been assigned by your supervisor to analyze home sales in your town for the last 5 months. Use following table, which shows the sale price for several homes in hundreds of thousands of dollars. Note: some months have fewer values. June July August $276 September $204 October $210 $410 $310 $175 $244 $199 $345 $219 $350 $255 - - - Calculate the mean for the sample to the nearest thousand. Your answer Calculate the standard deviation for the sample. Round your answer to the nearest thousand. Your answer


Inverse Normal Distribution
The method used for finding the corresponding z-critical value in a normal distribution using the known probability is said to be an inverse normal distribution. The inverse normal distribution is a continuous probability distribution with a family of two parameters.
Mean, Median, Mode
It is a descriptive summary of a data set. It can be defined by using some of the measures. The central tendencies do not provide information regarding individual data from the dataset. However, they give a summary of the data set. The central tendency or measure of central tendency is a central or typical value for a probability distribution.
Z-Scores
A z-score is a unit of measurement used in statistics to describe the position of a raw score in terms of its distance from the mean, measured with reference to standard deviation from the mean. Z-scores are useful in statistics because they allow comparison between two scores that belong to different normal distributions.


Trending now
This is a popular solution!

Step by step
Solved in 2 steps


