You are asked to do quality control and quality assurance during the determination of lead concentration in a city's tap water using ICP-AES. Plotting ICP -AES signal as a function of lead concentration (in ppb) gave you a linear regression equation of y = 1.97x + 1.50 with an R^2=0.99. The instrumental response (signal) had a standard deviation of 0.75. What is the limit of quantitation in terms of lead concentration (ppb) of this instrumental method? %3D
You are asked to do quality control and quality assurance during the determination of lead concentration in a city's tap water using ICP-AES. Plotting ICP -AES signal as a function of lead concentration (in ppb) gave you a linear regression equation of y = 1.97x + 1.50 with an R^2=0.99. The instrumental response (signal) had a standard deviation of 0.75. What is the limit of quantitation in terms of lead concentration (ppb) of this instrumental method? %3D

Chapter15: Electrophoresis And Other Separation Methods
Section: Chapter Questions
Problem 5P

Related questions
Question
1
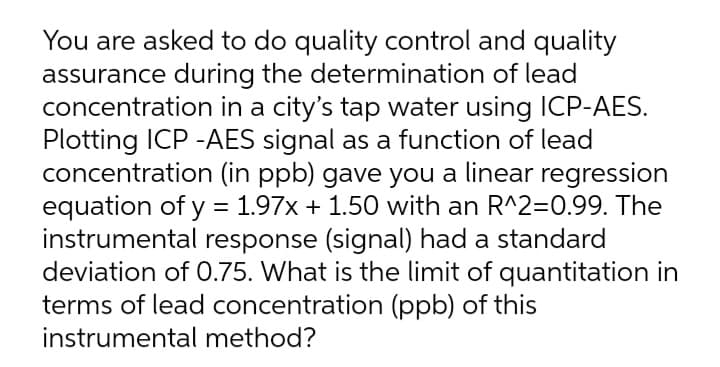
Transcribed Image Text:You are asked to do quality control and quality
assurance during the determination of lead
concentration in a city's tap water using ICP-AES.
Plotting ICP -AES signal as a function of lead
concentration (in ppb) gave you a linear regression
equation of y = 1.97x + 1.50 with an R^2=0.99. The
instrumental response (signal) had a standard
deviation of 0.75. What is the limit of quantitation in
terms of lead concentration (ppb) of this
instrumental method?
Expert Solution
This question has been solved!
Explore an expertly crafted, step-by-step solution for a thorough understanding of key concepts.

Step by step
Solved in 4 steps

Knowledge Booster


Learn more about
Need a deep-dive on the concept behind this application? Look no further. Learn more about this topic, chemistry and related others by exploring similar questions and additional content below.Recommended textbooks for you

Principles of Instrumental Analysis
Chemistry
ISBN:
9781305577213
Author:
Douglas A. Skoog, F. James Holler, Stanley R. Crouch
Publisher:
Cengage Learning
Principles of Instrumental Analysis
Chemistry
ISBN:
9781305577213
Author:
Douglas A. Skoog, F. James Holler, Stanley R. Crouch
Publisher:
Cengage Learning