You are conducting a study to see if the proportion of voters who prefer the Democratic candidate is significantly larger than 65% at a level of significance of a = 0.05. According to your sample, 66 out of 94 potential voters prefer the Democratic candidate. a. For this study, we should use Select an answer b. The null and alternative hypotheses would be: Ho: ? v|| Select an answer v (please enter a decimal) H1:? v||Select an answer (Please enter a decimal) c. The test statistic ? v = (please show your answer to 3 decimal places.)
You are conducting a study to see if the proportion of voters who prefer the Democratic candidate is significantly larger than 65% at a level of significance of a = 0.05. According to your sample, 66 out of 94 potential voters prefer the Democratic candidate. a. For this study, we should use Select an answer b. The null and alternative hypotheses would be: Ho: ? v|| Select an answer v (please enter a decimal) H1:? v||Select an answer (Please enter a decimal) c. The test statistic ? v = (please show your answer to 3 decimal places.)

Holt Mcdougal Larson Pre-algebra: Student Edition 2012
1st Edition
ISBN:9780547587776
Author:HOLT MCDOUGAL
Publisher:HOLT MCDOUGAL
Chapter11: Data Analysis And Probability
Section: Chapter Questions
Problem 8CR

Related questions

Question
Transcribed Image Text:gcc.instructure.com/courses/12156/assignments/259230
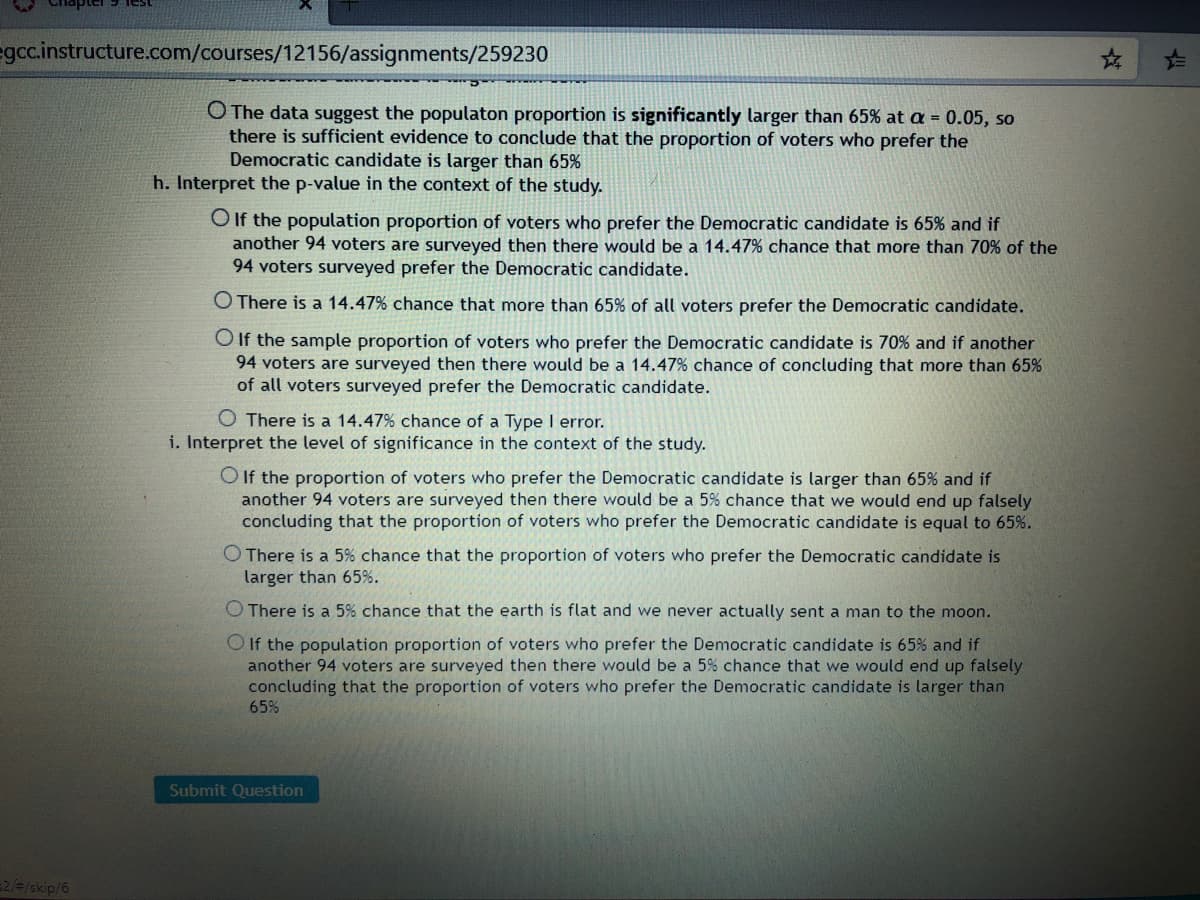
O The data suggest the populaton proportion is significantly larger than 65% at a = 0.05, so
there is sufficient evidence to conclude that the proportion of voters who prefer the
Democratic candidate is larger than 65%
h. Interpret the p-value in the context of the study.
O If the population proportion of voters who prefer the Democratic candidate is 65% and if
another 94 voters are surveyed then there would be a 14.47% chance that more than 70% of the
94 voters surveyed prefer the Democratic candidate.
O There is a 14.47% chance that more than 65% of all voters prefer the Democratic candidate.
O If the sample proportion of voters who prefer the Democratic candidate is 70% and if another
94 voters are surveyed then there would be a 14.47% chance of concluding that more than 65%
of all voters surveyed prefer the Democratic candidate.
O There is a 14.47% chance of a Type I error.
i. Interpret the level of significance in the context of the study.
O If the proportion of voters who prefer the Democratic candidate is larger than 65% and if
another 94 voters are surveyed then there would be a 5% chance that we would end up falsely
concluding that the proportion of voters who prefer the Democratic candidate is equal to 65%.
O There is a 5% chance that the proportion of voters who prefer the Democratic candidate is
larger than 65%.
O There is a 5% chance that the earth is flat and we never actually sent a man to the moon.
O If the population proportion of voters who prefer the Democratic candidate is 65% and if
another 94 voters are surveyed then there would be a 5% chance that we would end up falsely
concluding that the proportion of voters who prefer the Democratic candidate is larger than
65%
Submit Question
2/=/skip/6
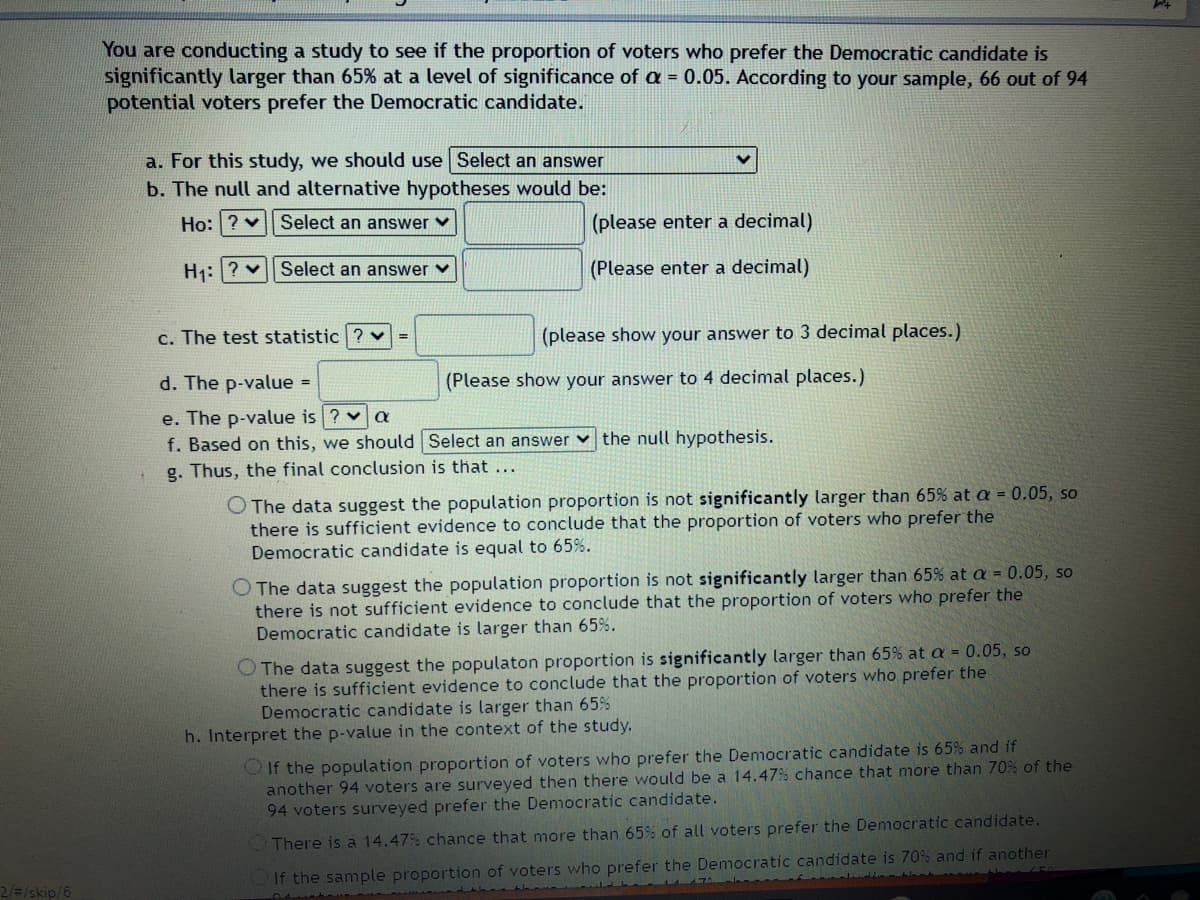
Transcribed Image Text:You are conducting a study to see if the proportion of voters who prefer the Democratic candidate is
significantly larger than 65% at a level of significance of a = 0.05. According to your sample, 66 out of 94
potential voters prefer the Democratic candidate.
a. For this study, we should use Select an answer
b. The null and alternative hypotheses would be:
Ho: ? v| Select an answer v
(please enter a decimal)
H1: |? v Select an answer v
(Please enter a decimal)
c. The test statistic ? v
(please show your answer to 3 decimal places.)
d. The p-value =
(Please show your answer to 4 decimal places.)
e. The p-value is ? va
f. Based on this, we should Select an answer v the null hypothesis.
g. Thus, the final conclusion is that ...
O The data suggest the population proportion is not significantly larger than 65% at a = 0.05, so
there is sufficient evidence to conclude that the proportion of voters who prefer the
Democratic candidate is equal to 65%.
O The data suggest the population proportion is not significantly larger than 65% at a = 0.05, so
there is not sufficient evidence to conclude that the proportion of voters who prefer the
Democratic candidate is larger than 65%.
O The data suggest the populaton proportion is significantly larger than 65% at a = 0.05, so
there is sufficient evidence to conclude that the proportion of voters who prefer the
Democratic candidate is larger than 65%
h. Interpret the p-value in the context of the study.
O If the population proportion of voters who prefer the Democratic candidate is 65% and if
another 94 voters are surveyed then there would be a 14.47% chance that more than 70% of the
94 voters surveyed prefer the Democratic candidate.
There is a 14.47% chance that more than 65% of all voters prefer the Democratic candidate.
If the sample proportion of voters who prefer the Democratic candidate is 70% and if another
2/=/skip/6
Expert Solution
This question has been solved!
Explore an expertly crafted, step-by-step solution for a thorough understanding of key concepts.

Step by step
Solved in 2 steps

Knowledge Booster


Learn more about
Need a deep-dive on the concept behind this application? Look no further. Learn more about this topic, statistics and related others by exploring similar questions and additional content below.Recommended textbooks for you
Holt Mcdougal Larson Pre-algebra: Student Edition…
Algebra
ISBN:
9780547587776
Author:
HOLT MCDOUGAL
Publisher:
HOLT MCDOUGAL

College Algebra
Algebra
ISBN:
9781305115545
Author:
James Stewart, Lothar Redlin, Saleem Watson
Publisher:
Cengage Learning

Algebra & Trigonometry with Analytic Geometry
Algebra
ISBN:
9781133382119
Author:
Swokowski
Publisher:
Cengage
Holt Mcdougal Larson Pre-algebra: Student Edition…
Algebra
ISBN:
9780547587776
Author:
HOLT MCDOUGAL
Publisher:
HOLT MCDOUGAL
College Algebra
Algebra
ISBN:
9781305115545
Author:
James Stewart, Lothar Redlin, Saleem Watson
Publisher:
Cengage Learning
Algebra & Trigonometry with Analytic Geometry
Algebra
ISBN:
9781133382119
Author:
Swokowski
Publisher:
Cengage