You are conducting a test of the claim that the row variables and the column variables are dependent in the following contingency table. Ho: The variables are independent Ha: At least two variables are dependent (Claim) Y A 32 13 29 18 67 24 Expected Frequencies (row i and column j) (Total;) - (Total;) E j= Total Give all answers rounded to 3 places after the decimal point, if necessary. (a) Enter the expected frequencies below: Y A. B Residual Values (Row i and column j) Chỉ Square Test Statistic Degrees of Freedom E. ) x (0-E) Σ (0,, df = (#ofRows – 1)(#ofColumns – 1) (b) Enter the Residual Values below:
You are conducting a test of the claim that the row variables and the column variables are dependent in the following contingency table. Ho: The variables are independent Ha: At least two variables are dependent (Claim) Y A 32 13 29 18 67 24 Expected Frequencies (row i and column j) (Total;) - (Total;) E j= Total Give all answers rounded to 3 places after the decimal point, if necessary. (a) Enter the expected frequencies below: Y A. B Residual Values (Row i and column j) Chỉ Square Test Statistic Degrees of Freedom E. ) x (0-E) Σ (0,, df = (#ofRows – 1)(#ofColumns – 1) (b) Enter the Residual Values below:

Linear Algebra: A Modern Introduction
4th Edition
ISBN:9781285463247
Author:David Poole
Publisher:David Poole
Chapter7: Distance And Approximation
Section7.3: Least Squares Approximation
Problem 29EQ

Related questions
Question
100%
Transcribed Image Text:E
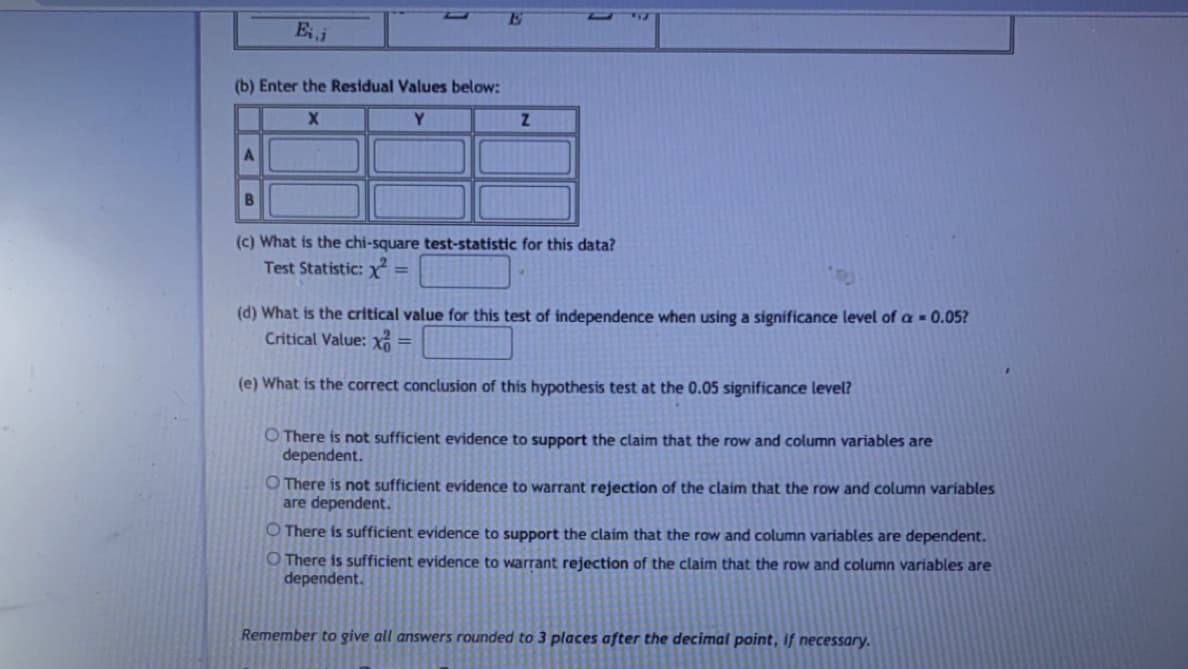
(b) Enter the Residual Values below:
Y.
(c) What is the chi-square test-statistic for this data?
Test Statistic: X =
(d) What is the critical value for this test of independence when using a significance level of a = 0.05?
Critical Value: xổ
%3D
(e) What is the correct conclusion of this hypothesis test at the 0.05 significance level?
O There is not sufficient evidence to support the claim that the row and column variables are
dependent.
O There is not sufficient evidence to warrant rejection of the claim that the row and column variables
are dependent.
O There is sufficient evidence to support the claim that the row and column variables are dependent.
O There is sufficient evidence to warrant rejection of the claim that the row and column variables are
dependent.
Remember to give all answers rounded to 3 places after the decimal point, if necessary.
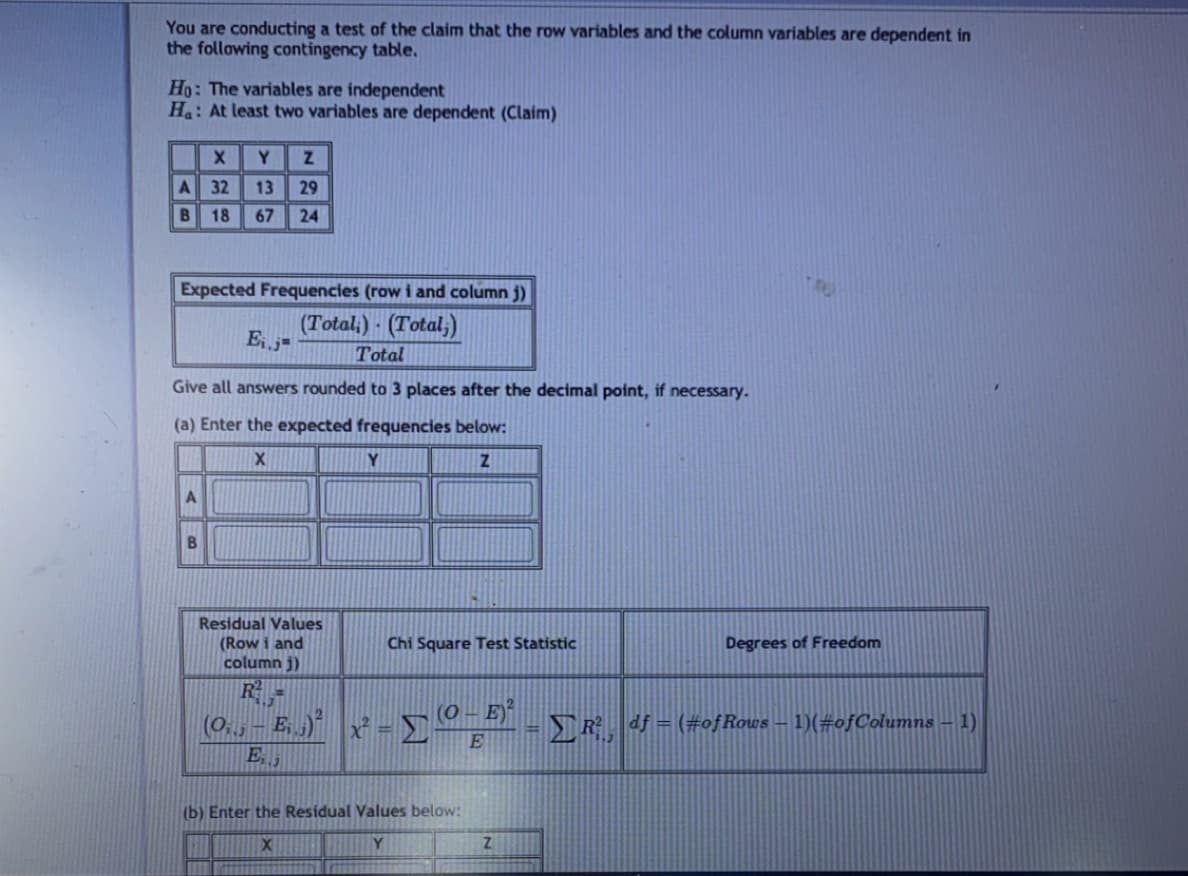
Transcribed Image Text:You are conducting a test of the claim that the row variables and the column variables are dependent in
the following contingency table.
Ho: The variables are independent
Ha: At least two variables are dependent (Claim)
Y
32
13
29
18
67
24
Expected Frequencies (row i and column j)
(Total;) - (Total;)
Ej-
Total
Give all answers rounded to 3 places after the decimal point, if necessary.
(a) Enter the expected frequencies below:
Y
A.
Residual Values
(Row i and
column j)
Chi Square Test Statistic
Degrees of Freedom
(0. , – E, ;)*
(0 - E)
x = D
TRdf = (#ofRows – 1)(#ofColumns – 1)
(b) Enter the Residual Values below:
Y
Expert Solution
This question has been solved!
Explore an expertly crafted, step-by-step solution for a thorough understanding of key concepts.

Step by step
Solved in 6 steps

Recommended textbooks for you
Linear Algebra: A Modern Introduction
Algebra
ISBN:
9781285463247
Author:
David Poole
Publisher:
Cengage Learning
Linear Algebra: A Modern Introduction
Algebra
ISBN:
9781285463247
Author:
David Poole
Publisher:
Cengage Learning