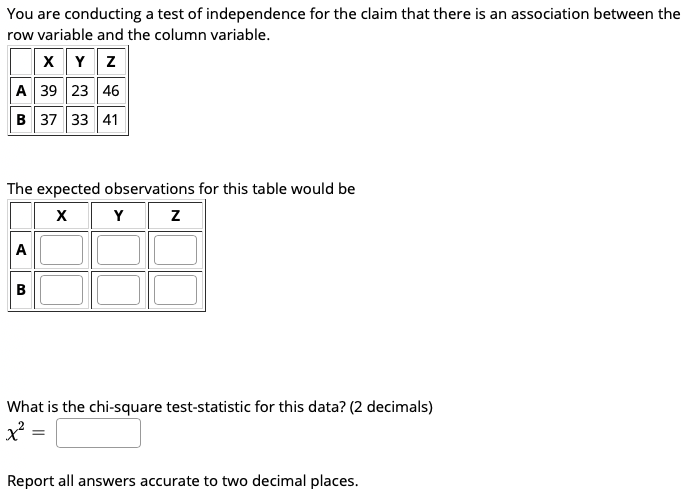
You are conducting a test of independence for the claim that there is an association between row variable and the column variable. x Y z A 39 23 46 B 37 33 41 The expected observations for this table would be Y z A в What is the chi-square test-statistic for this data? (2 decimals) x² =


Q: You are conducting a test of the claim that the row variable and the column variable are dependent…
A:
Q: Given are five observations for two variables, a and y. 4 9 12 14 20 Yi 50 52 40 22 10 The estimated…
A: In regression analysis, by using the terms SSE, SST and SSR we have the following formulae…
Q: You are conducting a test of the claim that the row variable and the column variable are dependent…
A: For the given data We have to calculate expected frequency Chi-square statistics Critical value…
Q: You are conducting a test of independence for the claim that there is an association between the row…
A: Given that Observed Frequency table X Y Z A 31 4 28 B 20 62 25
Q: You are conducting a test of the claim that the row variable and the column variable are dependent…
A: The chi square test of independence is used to test the dependency of two categorical variables. For…
Q: You are conducting a test of the claim that the row variable and the column variable are dependent…
A: a) Expected frequencies x y z A 46.523 47.748 36.729 B 29.477 30.252 23.271 b)Chi…
Q: You are conducting a test of the claim that the row variable and the column variable are dependent…
A: Given data: Observed frequencies (O): X Y Z A 42 22 5 B 41 31 15 Expected frequencies…
Q: You are conducting a test of independence for the claim that there is an association between the row…
A: Number of rows in a contingency table = 2 Number of columns in a contingency table = 3 Total number…
Q: You are conducting a test of the claim that the row variable and the column variable are dependent…
A:
Q: You are conducting a test of the claim that the row variable and the column variable are dependent…
A: Introduction: As it is of interest to test whether the row variable and column variable are…
Q: You are conducting a test of the claim that the row variables and the column variables are dependent…
A: Solution: The given table of data is State the hypotheses. Null hypothesis: H0: The variables are…
Q: You are conducting a test of the claim that the row variable and the column variable are dependent…
A: Note: " Since you have asked multiple sub-parts, we will solve the first three sub-parts for you. If…
Q: You are conducting a test of the claim that the row variable and the column variable are dependent…
A:
Q: You are conducting a test of the claim that the row variable and the column variable are dependent…
A:
Q: You are conducting a test of the claim that the row variable and the column variable are dependent…
A:
Q: You are conducting a test of independenc for the claim that there is an association between the row…
A: The following table is given in the question: X Y Z Row total A 8 48 31 87 B 18 56 23 97…
Q: You are conducting a test of independence for the claim that there is an association between the row…
A: From the provided information, X Y Z Total A 40 30 16 86 B 32 17…
Q: You are conducting a test of independence for the claim that there is an association between the row…
A: The calculation of totals of row and column variables and grand total of contingency table is, The…
Q: You are conducting a test of independence for the claim that there is an association between the row…
A: See the handwritten solution
Q: You are conducting a test of independence for the claim that there is an association between the row…
A:
Q: (a) Enter the expected frequencies below: X Y Z A B (b) What is the chi-square…
A:
Q: You are conducting a test of the claim that the row variable and the column variable are dependent…
A: a) The appropriate Null and Alternative Hypotheses are given below: Null hypothesis: H0: The…
Q: You are conducting a test of independence for the claim that there is an association between the row…
A:
Q: You are conducting a test of independence for the claim that there is an association between the row…
A: Given that We have 2× 3 contingency table Row=2 and column =3 Let R represent the Row and C…
Q: You are conducting a test of independence for the claim that there is an association between the row…
A: From the given information, it is clear that, The observed data are, X Y Z Total A 35 29 6…
Q: You are conducting a test of the claim that the row variable and the column variable are dependent…
A: (a) In this case, the claim of the test is response and employment status are independent.…
Q: You are conducting a test of the claim that the row variable and the column variable are dependent…
A: In this context, it is appropriate to use Chi-square test of independence. Hypotheses: H0 : The row…
Q: You are conducting a test of independence for the claim that there is an association between the row…
A: There are two categorical variables which are row and column variables. We have to find the expected…
Q: You are conducting a test of the claim that the row variable and the column variable are dependent…
A: Solution: a. The given data is
Q: You are conducting a test of independence for the claim that there is an association between the row…
A:
Q: You are conducting a test of independence for the claim that there is an association between the row…
A: Solution: The two way table of data is
Q: You are conducting a test of independence for the daim that there is an association between the row…
A: To find the chi square test statistics
Q: Given are five observations for two variables, x and y. 1 3 12 15 17 Yi 54 51 43 25 12 The estimated…
A:
Q: You are conducting a test of the claim that the row variable and the column variable are dependent…
A: Answer a) expected frequencies X Y Z A 29.567 20.1058 32.327 B 45.433 30.894 49.673
Q: You are conducting a test of the claim that the row variable and the column variable are dependent…
A: (a) The row and column total is given below: X Y Z Total A 19 34 44 97…
Q: You are conducting a test of the claim that the row variable and the column variable are dependent…
A: Denote oij as the observed frequency for ith row and jth column (i =1, 2; j =1, 2,3) and eij as the…
Q: Given are five observations for two variables, a and y. 2 8 13 17 20 51 60 46 16 10 The estimated…
A: Solution-: Given data: X Y 2 51 8 60 13 46 17 16 20 10 Given the estimated…
Q: Given are five observations for two variables, x and y. 7 10 15 20 Yi 51 56 40 17 14 The estimated…
A: Solution:- Given the estimated regression equation is, Y^=60.90-2.39*X We have following table: X…
Q: ou are conducting a test of the claim that the row variable and the column variable are dependent in…
A: Given data: X Y Z Total A 3 39 24 66 B 17 53 32 102 Total 20 92 56 168
Q: You are conducting a test of independence for the claim that there is an association between the row…
A: Given data X Y Z A 45 6 60 B 28 3 28
Q: You are conducting a test of independence for the claim that there is an association between the row…
A: From the provided information, X Y Z Total A 30 37 38 105 B 41 42…
Q: The following data represent the number of calculators sold per day at a retail shop and their…
A: 1. Least squares regression line: Let us denote X as the total employees hours worked per week and Y…
Q: are conducting a test of independence for the daim that there is an association between the row able…
A: From the given information we conduct chi squared test.
Q: There is not sufficient evidence to warrant rejection of the claim that the row and column variables…
A:
Q: You are conducting a test of the claim that the row variable and the column variable are dependent…
A: Solution : Given that , We need to conduct a Chi-Square test of Independence. X Y Z Total A…
Q: You are conducting a test of the claim that the row variable and the column variable are dependent…
A: State the hypotheses. Null hypothesis: Alternative hypothesis: Obtain the expected frequencies…
Q: You are conducting a test of the claim that the row variable and the column variable are dependent…
A: X Y Z total A 21 33 26 80 B 49 51 16 116 total 70 84 42 196 expected frequency X…
Q: You are conducting a test of independence for the claim that there is an association between the row…
A: Given that Contingency table. X Y Z A 20 45 41 B 30 37 42
Q: You are conducting a test of the claim that the row variable and the column variable are dependent…
A: Observed frequency X Y Z Total A 37 41 11 89 B 54 31 23 108 Total 91 72 34 N=197…
Q: You are conducting a test of independence for the claim that there is an association between the row…
A: State the hypotheses. Null hypothesis: Alternative hypothesis:


Trending now
This is a popular solution!

Step by step
Solved in 2 steps with 3 images


- You are conducting a test of independence for the claim that there is an association between the row variable and the column variable. X Y Z A 42 35 19 B 32 33 10 The expected observations for this table would be X Y Z A B What is the chi-square test-statistic for this data? (2 decimals)χ2=You are conducting a test of independence for the claim that there is an association between the row variable and the column variable. X Y Z A 46 23 53 B 46 26 40 The expected observations for this table would be X Y Z A B The resulting Pearson residuals are: X Y Z A B What is the chi-square test-statistic for this data?χ2=χ2= Report all answers accurate to three decimal places. CalculatorYou are conducting a test of independence for the claim that there is an association between the row variable and the column variable. X Y Z A 46 23 53 B 46 26 40 The expected observations for this table would be X Y Z A B The resulting Pearson residuals are: X Y Z A B What is the chi-square test-statistic for this data?χ2=χ2= Report all answers accurate to three decimal places.
- You are conducting a test of independence for the claim that there is an association between the row variable and the column variable. X Y Z A 42 49 30 B 27 39 21 The expected observations for this table would be X Y Z A B The resulting Pearson residuals are: X Y Z A B What is the chi-square test-statistic for this data?χ2=Report all answers accurate to three decimal places.You are conducting a test of the claim that the row variable and the column variable are dependent in the following contingency table. X Y Z A 51 37 32 B 29 24 26 Give all answers rounded to 2 places after the decimal point, if necessary. (a) Enter the expected frequencies below: X Y Z A B (b) What is the chi-square test-statistic for this data? Test Statistic: χ2= (c) What is the p-value for this test of independence P-Value: = What is the correct conclusion of this hypothesis test at the 0.005 significance level? There is sufficient evidence to warrant rejection of the claim that the row and column variables are dependent. There is not sufficient evidence to support the claim that the row and column variables are dependent. There is not sufficient evidence to warrant rejection of the claim that the row and column variables are dependent. There is sufficient evidence to support the claim that the row and column…which of these comparison between an ANOVA and t test is correct? A. a t test provides more flexibilty in research studies than an ANOVA B. An ANOVA examines wheater mean differences exists between conditions wheres t test does not C. An ANOVA can be used to compare three or more conditions wheres a t test cannot D. A t test can be used to compare two conditions wheres an ANOVA cannot.
- You are conducting a test of the claim that the row variable and the column variable are dependent in the following contingency table. X Y Z A 19 34 44 B 19 26 38 Give all answers rounded to 3 places after the decimal point, if necessary. (a) Enter the expected frequencies below: X Y Z A Correct Correct Correct B Correct Correct Correct (b) What is the chi-square test-statistic for this data? Test Statistic: χ2=χ2= Correct (c) What is the critical value for this test of independence when using a significance level of αα = 0.005? Critical Value: χ2=χ2=You run a regression analysis on a bivariate set of data (n=12). With ¯x=33.8 and ¯y=76., you obtain the regression equation y=0.392x−57.285 with a correlation coefficient of r=0.962. You want to predict what value (on average) for the response variable will be obtained from a value of 80 as the explanatory variable.What is the predicted response value?y =The coefficient of determination (r2) is a measure of the: a.) amount of variance in the dependent variable explained by the independent variable. b.) correlation between two variables. c.) variability of the dependent measure. d.) slope of a regression line.
- Q2. A fast-food chain decided to carry out an experiment to assess the influence of advertising expenditure on sales. Different relative changes in advertising expenditure, compared to the previous year, were made in eight regions of the country, and resulting changes in sales levels were observed the accompanying table shows the results. Increase in advertising expenditure (%) 0 5 15 20 25 30 35 40 Increase in sales (%) 5 10 18 25 35 50 60 65 Determine the value of ∑X, ∑X2, ∑Y, ∑Y2, ∑XY. Where X represent independent variable and Y for dependent variable. [2] Determine and interpret the coefficient of correlation between the two variables. [1] Determine the value of regressions coefficients and write down the simple linear regressionQ2. A fast-food chain decided to carry out an experiment to assess the influence of advertising expenditure on sales. Different relative changes in advertising expenditure, compared to the previous year, were made in eight regions of the country, and resulting changes in sales levels were observed the accompanying table shows the results. Increase in advertising expenditure (%) 0 5 15 20 25 30 35 40 Increase in sales (%) 5 10 18 25 35 50 60 65 Determine the value of ∑X, ∑X2, ∑Y, ∑Y2, ∑XY. Where X represent independent variable and Y for dependent variable. Determine and interpret the coefficient of correlation between the two variables. Determine the value of regressions coefficients and write down the simple linear regression model. Test the validity of the…(A) A population comprises of 9 people. Their IQ scores were recorded as 95, 135, 70,85,90,100,100, 110 and 115.What is the X value for a probability of 63.31% from left tail? (B) The regression linear model between two variables X and Y, in pairs, defined as X={4,2,9,5 2,4] and Y=[6,4,6,8,5,10] is equal to?