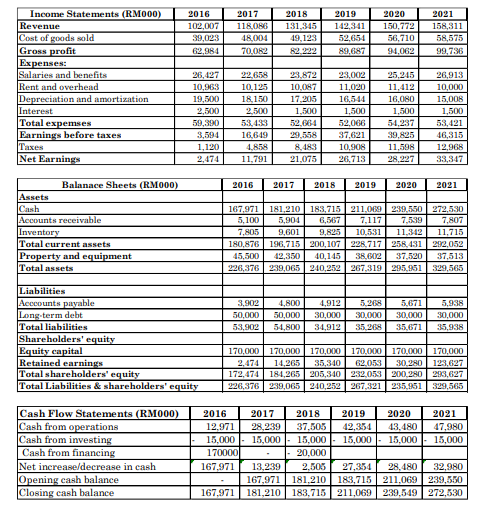
You are given the financial statements of a company for over the 6-year periods (2016 – 2021). Considering 2016 as the base year, compute the trend index for the following items: a. Revenue, cost of goods sold, total expenses and net earnings. Comment on the trends of each of the items. b. Total assets, total liabilities and shareholders’ equity. Comment on the trends of each of the items. c. Cash flow from operation, cash flow from investing, cash flow from financing and closing cash balances. Comment on the trends of each of the items.
You are given the financial statements of a company for over the 6-year periods (2016 – 2021). Considering 2016 as the base year, compute the trend index for the following items: a. Revenue, cost of goods sold, total expenses and net earnings. Comment on the trends of each of the items. b. Total assets, total liabilities and shareholders’ equity. Comment on the trends of each of the items. c. Cash flow from operation, cash flow from investing, cash flow from financing and closing cash balances. Comment on the trends of each of the items.

Fundamentals of Financial Management (MindTap Course List)
15th Edition
ISBN:9781337395250
Author:Eugene F. Brigham, Joel F. Houston
Publisher:Eugene F. Brigham, Joel F. Houston
Chapter4: Analysis Of Financial Statements
Section: Chapter Questions
Problem 24P: Income Statement for Year Ended December 31, 2018 (Millions of Dollars) Net sales 795.0 Cost of...

Related questions
Question
You are given the financial statements of a company for over the 6-year periods (2016 –
2021).
Considering 2016 as the base year, compute the trend index for the following items:
a. Revenue, cost of goods sold, total expenses and net earnings. Comment on the
trends of each of the items.
b. Total assets, total liabilities and shareholders’ equity. Comment on the trends of
each of the items.
c. Cash flow from operation, cash flow from investing, cash flow from financing and
closing cash balances. Comment on the trends of each of the items.
Transcribed Image Text:Income Statements (RM000)
Revenue
Cost of goods sold
Gross profit
Expenses:
Salaries and benefits
Rent and overhead
Depreciation and amortization
Interest
Total expemses
Earnings before taxes
Taxes
Net Earnings
2016
2017
2018
2019
2020
2021
102,007
118086
131,345
142,341
150,772
158,311
39,023
48,004
49,123
52,654
56,710
58,575
62,984
70,082
82.222
89,687
94.062
99,736
23.872
23,002
11.020
26,427
22,658
25,245
26,913
10.963
10,125
10.087
11,412
10.000
19,500
18,150
17,205
16,544
16,080
15.008
1,500
54,237
2,500
2,500
1,500
1,500
1,500
59,390
53,433
52,664
52,066
53,421
3,594
16,649
29,558
37,621
39,825
46.315
8,483
21,075
10,908
1,120
2,474
12,968
33,347
4,858
11,598
11,791
26,713
28,227
Balanace Sheets (RM000)
2016
2019
2017
2018
2020
2021
Assets
Cash
Accounts receivable
181,210 | 183,715 | 211,069
239,550 272,530
7,807
167,971
5,100
5,904
6,567
7,117
7,539
Inventory
Total eurrent assets
7,805
9.601
9,825
10,531
11,342
11,715
180,876
196,715 | 200,107 | 228,717 | 258,431 | 292,052
37,520
Property and equipment
Total assets
45,500
42,350
40,145
38,602
37,513
226,376 | 239,065 | 240,252 267,319 295,951| 329,565
Liabilities
Acccounts payable
3,902
4,800
4,912
5,268
5,671
5,938
Long-term debt
Total liabilities
50,000
50,000
30,000
30,000
30,000
30,000
53,902
54,800
34,912
35,268
35,671
35,938
Shareholders' equity
Equity capital
Retained earnings
Total shareholders' equity
Total Liabilities & shareholders' equity
170,000
170,000 170,000
170,000
170,000| 170,000
30,280| 123,627
35,340
172,474 184,265 | 205,340 232,053 200,280
239,065 | 240,252 | 267,321 235,951
2,474
14,265
62,053
293,627
226,376
329,565
Cash Flow Statements (RMO00)
Cash from operations
Cash from investing
Cash from financing
2016
2017
28,239
15,000
2018
37,505
2019
2020
2021
42,354
15,000
12,971
43,480
47,980
15,000
170000
167.971
15,000
20,000
15,000
15,000
Net increase/decrease in cash
Opening cash balance
Closing cash balance
13,239
167,971
167,971| 181,210
27,354
28,480
181,210 183,715 211,069 239,550
2,505
32,980
183,715| 211,069
239,549 272,530
Expert Solution
This question has been solved!
Explore an expertly crafted, step-by-step solution for a thorough understanding of key concepts.

Step by step
Solved in 5 steps

Knowledge Booster


Learn more about
Need a deep-dive on the concept behind this application? Look no further. Learn more about this topic, accounting and related others by exploring similar questions and additional content below.Recommended textbooks for you
Fundamentals of Financial Management (MindTap Cou…
Finance
ISBN:
9781337395250
Author:
Eugene F. Brigham, Joel F. Houston
Publisher:
Cengage Learning
Fundamentals of Financial Management (MindTap Cou…
Finance
ISBN:
9781337395250
Author:
Eugene F. Brigham, Joel F. Houston
Publisher:
Cengage Learning