You are given the following frequency distribution. Class Frequency A 15 B 20 C 30 D 35 Then, the relative frequency of the class B is Select one: O a. 20 O b. 0.35 О с. 30 O d. 15 Ое. 0.20 Of. 35 O g. 0.30
You are given the following frequency distribution. Class Frequency A 15 B 20 C 30 D 35 Then, the relative frequency of the class B is Select one: O a. 20 O b. 0.35 О с. 30 O d. 15 Ое. 0.20 Of. 35 O g. 0.30

Glencoe Algebra 1, Student Edition, 9780079039897, 0079039898, 2018
18th Edition
ISBN:9780079039897
Author:Carter
Publisher:Carter
Chapter10: Statistics
Section10.6: Summarizing Categorical Data
Problem 4AGP

Related questions
Question
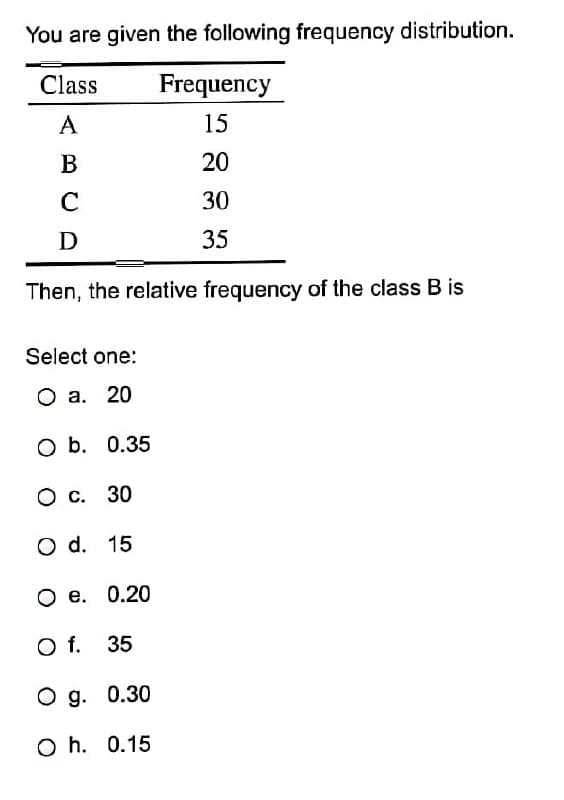
Transcribed Image Text:You are given the following frequency distribution.
Class
Frequency
A
15
В
20
C
30
D
35
Then, the relative frequency of the class B is
Select one:
O a. 20
O b. 0.35
О с. 30
O d. 15
Ое. 0.20
O f. 35
O g. 0.30
O h. 0.15
Expert Solution
This question has been solved!
Explore an expertly crafted, step-by-step solution for a thorough understanding of key concepts.

Step by step
Solved in 2 steps with 1 images

Recommended textbooks for you
Glencoe Algebra 1, Student Edition, 9780079039897…
Algebra
ISBN:
9780079039897
Author:
Carter
Publisher:
McGraw Hill
Glencoe Algebra 1, Student Edition, 9780079039897…
Algebra
ISBN:
9780079039897
Author:
Carter
Publisher:
McGraw Hill