You are given the sample mean and the population standard deviation. Use this information to construct the 90% and 95% confidence intervals for the population mean. Interpret the results and compare the widths of the confidence intervals. From a random sample of 36 business days, the mean closing price of a certain stock was $112.10. Assume the population standard deviation is $10.86. The 90% confidence interval is ( (Round to two decimal places as needed.) The 95% confidence interval is ( . (Round to two decimal places as needed.) Which interval wider? Choose the correct answer below. O The 90% confidence interval O The 95% confidence interval Interpret the results. O A. You can be 90% confident that the population mean price of the stock is outside the bounds of the 90% confidence interval, and 95% confident for the 95% interval. O B. You can be certain that the closing price of the stock was within the 90% confidence interval for approximately 32 of the 36 days, and was within the 95% confidence interval for approximately 34 of the 36 days. O C. You can be 90% confident that the population mean price of the stock is between the bounds of the 90% confidence interval, and 95% confident for the 95% interval. O D. You can be certain that the population mean price of the stock is either between the lower bounds of the 90% and 95% confidence intervals or the upper bounds of the 90% and 95% confidence intervals.
You are given the sample mean and the population standard deviation. Use this information to construct the 90% and 95% confidence intervals for the population mean. Interpret the results and compare the widths of the confidence intervals. From a random sample of 36 business days, the mean closing price of a certain stock was $112.10. Assume the population standard deviation is $10.86. The 90% confidence interval is ( (Round to two decimal places as needed.) The 95% confidence interval is ( . (Round to two decimal places as needed.) Which interval wider? Choose the correct answer below. O The 90% confidence interval O The 95% confidence interval Interpret the results. O A. You can be 90% confident that the population mean price of the stock is outside the bounds of the 90% confidence interval, and 95% confident for the 95% interval. O B. You can be certain that the closing price of the stock was within the 90% confidence interval for approximately 32 of the 36 days, and was within the 95% confidence interval for approximately 34 of the 36 days. O C. You can be 90% confident that the population mean price of the stock is between the bounds of the 90% confidence interval, and 95% confident for the 95% interval. O D. You can be certain that the population mean price of the stock is either between the lower bounds of the 90% and 95% confidence intervals or the upper bounds of the 90% and 95% confidence intervals.

Glencoe Algebra 1, Student Edition, 9780079039897, 0079039898, 2018
18th Edition
ISBN:9780079039897
Author:Carter
Publisher:Carter
Chapter10: Statistics
Section10.3: Measures Of Spread
Problem 26PFA

Related questions
Question
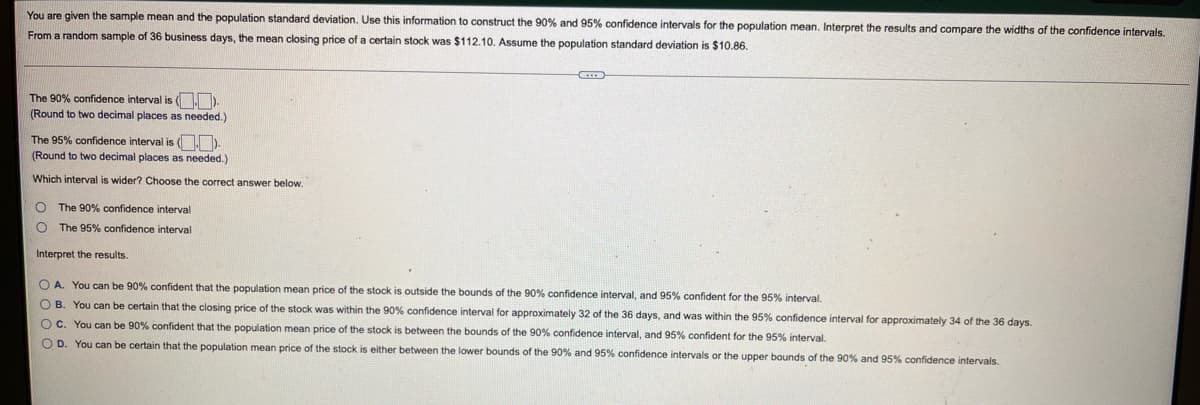
Transcribed Image Text:You are given the sample mean and the population standard deviation. Use this information to construct the 90% and 95% confidence intervals for the population mean. Interpret the results and compare the widths of the confidence intervals.
From a random sample of 36 business days, the mean closing price of a certain stock was $112.10. Assume the population standard deviation is $10.86.
The 90% confidence interval is (
(Round to two decimal places as needed.)
The 95% confidence interval is ( .
(Round to two decimal places as needed.)
Which interval
wider? Choose the correct answer below.
O The 90% confidence interval
O The 95% confidence interval
Interpret the results.
O A. You can be 90% confident that the population mean price of the stock is outside the bounds of the 90% confidence interval, and 95% confident for the 95% interval.
O B. You can be certain that the closing price of the stock was within the 90% confidence interval for approximately 32 of the 36 days, and was within the 95% confidence interval for approximately 34 of the 36 days.
O C. You can be 90% confident that the population mean price of the stock is between the bounds of the 90% confidence interval, and 95% confident for the 95% interval.
O D. You can be certain that the population mean price of the stock is either between the lower bounds of the 90% and 95% confidence intervals or the upper bounds of the 90% and 95% confidence intervals.
Expert Solution
This question has been solved!
Explore an expertly crafted, step-by-step solution for a thorough understanding of key concepts.

Step by step
Solved in 2 steps with 2 images

Recommended textbooks for you
Glencoe Algebra 1, Student Edition, 9780079039897…
Algebra
ISBN:
9780079039897
Author:
Carter
Publisher:
McGraw Hill
Glencoe Algebra 1, Student Edition, 9780079039897…
Algebra
ISBN:
9780079039897
Author:
Carter
Publisher:
McGraw Hill