You are performing a study about weekly per capita milk consumption. A previous study found weekly per capita milk consumption to be normally distributed, with a mean of 47.5 fluid ounces and a standard deviation of 10.9 fluid ounces. You randomly sample 30 people and record the weekly milk consumptions shown below. 36 55 30 40 42 49 32 65 38 48 43 27 39 54 44 46 45 53 51 50 36 31 24 45 60 44 50 46 58 36 leheto 26.5 625 265 62 5 26.5 62.5 62.5 26.5 62.5 Volume Volume Volume Volume Do the consumptions appear to be normally distributed? Explain. Choose the correct answer below. O A. No, because the histogram is neither symmetric nor bell-shaped. O B. Yes, because the histogram is neither symmetric nor bell-shaped. OC. No, because the histogram is symmetric and bell-shaped. &D. Yes, because the histogram is symmetric and bel-shaped. (b) Find the mean of your sample. The mean is 43.9 (Round to one decimr Find the standard dev le. The standard deviatic greater (Round to one decimi less (c) Compare the mea riation of your sample with those of the previous study. Discuss the differences. The sample mean is than the previous mean, so, on average, consumption from the sample is than in the previous study. The sample standard deviation is than the previous standard deviation by, so the milk consumption is spread out in the sample.
You are performing a study about weekly per capita milk consumption. A previous study found weekly per capita milk consumption to be normally distributed, with a mean of 47.5 fluid ounces and a standard deviation of 10.9 fluid ounces. You randomly sample 30 people and record the weekly milk consumptions shown below. 36 55 30 40 42 49 32 65 38 48 43 27 39 54 44 46 45 53 51 50 36 31 24 45 60 44 50 46 58 36 leheto 26.5 625 265 62 5 26.5 62.5 62.5 26.5 62.5 Volume Volume Volume Volume Do the consumptions appear to be normally distributed? Explain. Choose the correct answer below. O A. No, because the histogram is neither symmetric nor bell-shaped. O B. Yes, because the histogram is neither symmetric nor bell-shaped. OC. No, because the histogram is symmetric and bell-shaped. &D. Yes, because the histogram is symmetric and bel-shaped. (b) Find the mean of your sample. The mean is 43.9 (Round to one decimr Find the standard dev le. The standard deviatic greater (Round to one decimi less (c) Compare the mea riation of your sample with those of the previous study. Discuss the differences. The sample mean is than the previous mean, so, on average, consumption from the sample is than in the previous study. The sample standard deviation is than the previous standard deviation by, so the milk consumption is spread out in the sample.

MATLAB: An Introduction with Applications
6th Edition
ISBN:9781119256830
Author:Amos Gilat
Publisher:Amos Gilat
Chapter1: Starting With Matlab
Section: Chapter Questions
Problem 1P

Related questions
Question
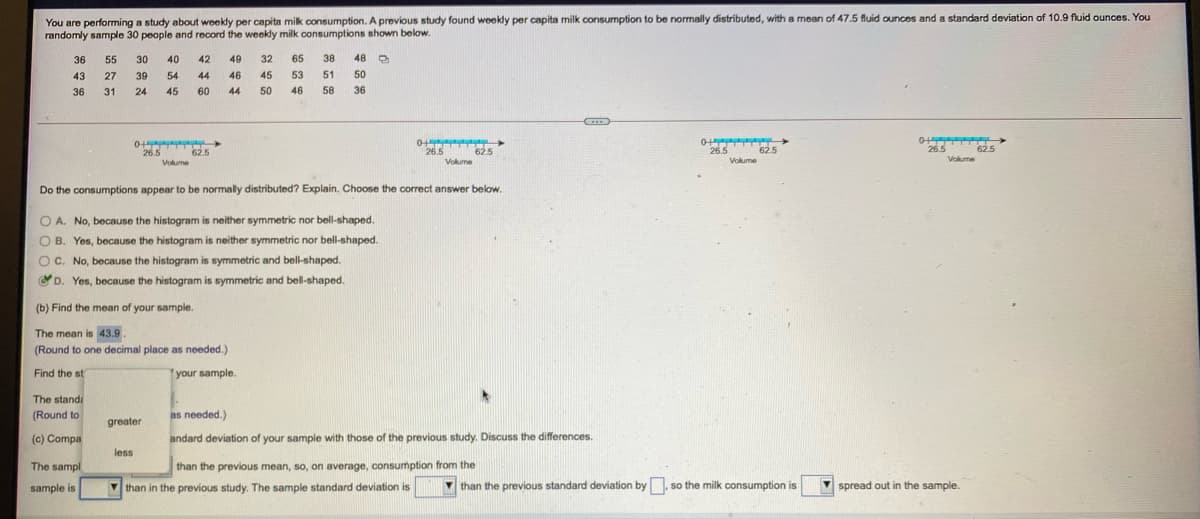
Transcribed Image Text:You are performing a study about weekly per capita mik consumption. A previous study found weekly per capita milk consumption to be normally distributed, with a mean of 47.5 fluid ounces and a standard deviation of 10.9 fluid ounces. You
randomly sample 30 people and record the weekly milk consumptions shown below.
36
55
30
40
42
49
32
65
38
48 D
43
27
39
54
44
46
45
53
51
50
36
31
24
45
60
44
50
46
58
36
62.5
26.5
26.5
62.5
26.5
62.5
62.5
Volume
26.5
Volume
Volume
Volume
Do the consumptions appear to be normally distributed? Explain. Choose the correct answer below.
O A. No, because the histogram is neither symmetric nor bell-shaped.
O B. Yes, because the histogram is neither symmetric nor bell-shaped.
O C. No, because the histogram is symmetric and bell-shaped.
OD. Yes, because the histogram is symmetric and bell-shaped.
(b) Find the mean of your sample.
The mean is 43.9.
(Round to one decimal place as needed.)
Find the st
Tyour sample.
The standi
(Round to
as needed.)
greaten
(c) Compa
andard deviation of your sample with those of the previous study. Discuss the differences.
less
The sampl
than the previous mean, so, on average, onsumption from the
sample is
V than in the previous study. The sample standard deviation is
than the previous standard deviation by, so the milk consumption is
spread out in the sample.
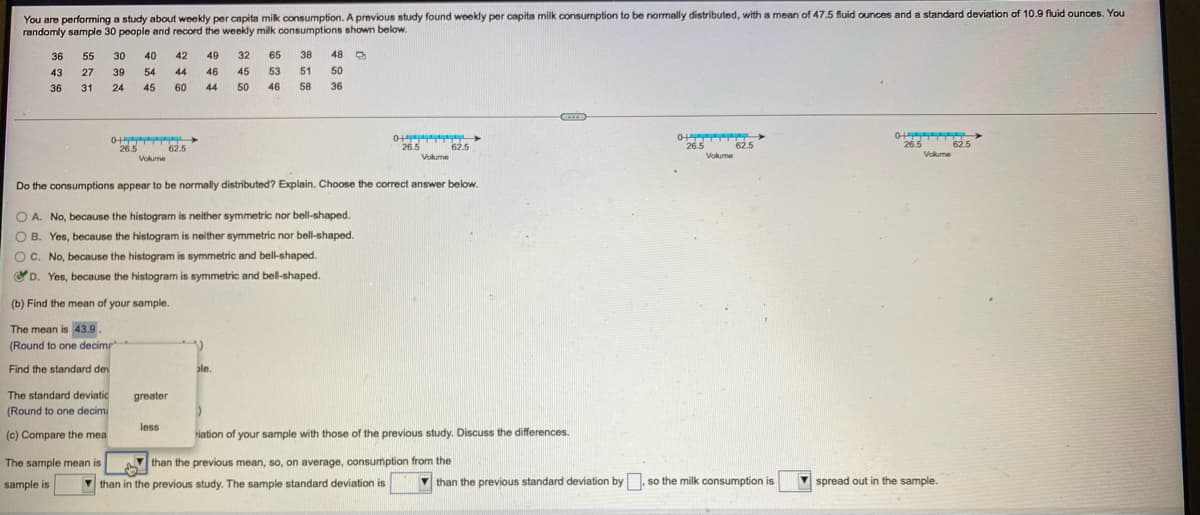
Transcribed Image Text:You are performing a study about weekly per capita milk consumption. A previous study found weekly per capita milk consumption to be normally distributed, with a mean of 47.5 fluid ounces and a standard deviation of 10.9 fluid ounces. You
randomly sample 30 people and record the weekly milk consumptions shown below.
36
55
30
40
42
49
32
65
38
48
43
27
39
54
44
46
45
53
51
50
36
31
24
45
60
44
50
46
58
36
0+
26.5 62.5
26.5
Volume
265 625
26.5
lehrto
62.5
62.5
62.5
Volume
Volume
Volume
Do the consumptions appear to be normally distributed? Explain. Choose the correct answer below.
O A. No, because the histogram is neither symmetric nor bell-shaped.
O B. Yes, because the histogram is neither symmetric nor bell-shaped.
OC. No, because the histogram is symmetric and bell-shaped.
D. Yes, because the histogram is symmetric and bell-shaped.
(b) Find the mean of your sample.
The mean is 43.9.
(Round to one decimr
Find the standard dev
le.
The standard deviatic
greater
(Round to one decimi
less
(c) Compare the mea
riation of your sample with those of the previous study. Discuss the differences.
The sample mean is
than the previous mean, so, on average, consumption from the
sample is
than in the previous study. The sample standard deviation is
than the previous standard deviation by, so the milk consumption is
spread out in the sample.
Expert Solution
Step 1
As part A is not given solved for parts b and c.
B Based on the given data the sample mean and standard deviation are calculated by using the formula below.

Trending now
This is a popular solution!

Step by step
Solved in 3 steps with 2 images

Recommended textbooks for you
MATLAB: An Introduction with Applications
Statistics
ISBN:
9781119256830
Author:
Amos Gilat
Publisher:
John Wiley & Sons Inc

Probability and Statistics for Engineering and th…
Statistics
ISBN:
9781305251809
Author:
Jay L. Devore
Publisher:
Cengage Learning

Statistics for The Behavioral Sciences (MindTap C…
Statistics
ISBN:
9781305504912
Author:
Frederick J Gravetter, Larry B. Wallnau
Publisher:
Cengage Learning
MATLAB: An Introduction with Applications
Statistics
ISBN:
9781119256830
Author:
Amos Gilat
Publisher:
John Wiley & Sons Inc
Probability and Statistics for Engineering and th…
Statistics
ISBN:
9781305251809
Author:
Jay L. Devore
Publisher:
Cengage Learning
Statistics for The Behavioral Sciences (MindTap C…
Statistics
ISBN:
9781305504912
Author:
Frederick J Gravetter, Larry B. Wallnau
Publisher:
Cengage Learning

Elementary Statistics: Picturing the World (7th E…
Statistics
ISBN:
9780134683416
Author:
Ron Larson, Betsy Farber
Publisher:
PEARSON

The Basic Practice of Statistics
Statistics
ISBN:
9781319042578
Author:
David S. Moore, William I. Notz, Michael A. Fligner
Publisher:
W. H. Freeman

Introduction to the Practice of Statistics
Statistics
ISBN:
9781319013387
Author:
David S. Moore, George P. McCabe, Bruce A. Craig
Publisher:
W. H. Freeman