UESTION3 1. The table below shows the one-year sales data for a certain part. Month Demand Month Demand January Marc February March 138 July August September October 140 142 107 185 145 April May June 131 113 144 November 189 135 December 128 a. Compute the one-step-ahead 3-month and 6-month moving-average forecasts for July through December. b. Compute the MAD for the forecasts obtained in part (a). What effect does increasing N from 3 to 6 have on the forecasts? c. Use the arithmetic average of the first six months of data as a baseline to initialize the exponential smoothing. Compute the one-step-ahead exponential smoothing forecasts for July through December, assuming a = 0.25. d. Compare the accuracy of the forecasts obtained in part (c) with the one-step ahead six-month moving-average forecasts obtained in part (a).
UESTION3 1. The table below shows the one-year sales data for a certain part. Month Demand Month Demand January Marc February March 138 July August September October 140 142 107 185 145 April May June 131 113 144 November 189 135 December 128 a. Compute the one-step-ahead 3-month and 6-month moving-average forecasts for July through December. b. Compute the MAD for the forecasts obtained in part (a). What effect does increasing N from 3 to 6 have on the forecasts? c. Use the arithmetic average of the first six months of data as a baseline to initialize the exponential smoothing. Compute the one-step-ahead exponential smoothing forecasts for July through December, assuming a = 0.25. d. Compare the accuracy of the forecasts obtained in part (c) with the one-step ahead six-month moving-average forecasts obtained in part (a).

Algebra & Trigonometry with Analytic Geometry
13th Edition
ISBN:9781133382119
Author:Swokowski
Publisher:Swokowski
Chapter7: Analytic Trigonometry
Section7.6: The Inverse Trigonometric Functions
Problem 91E

Related questions
Question
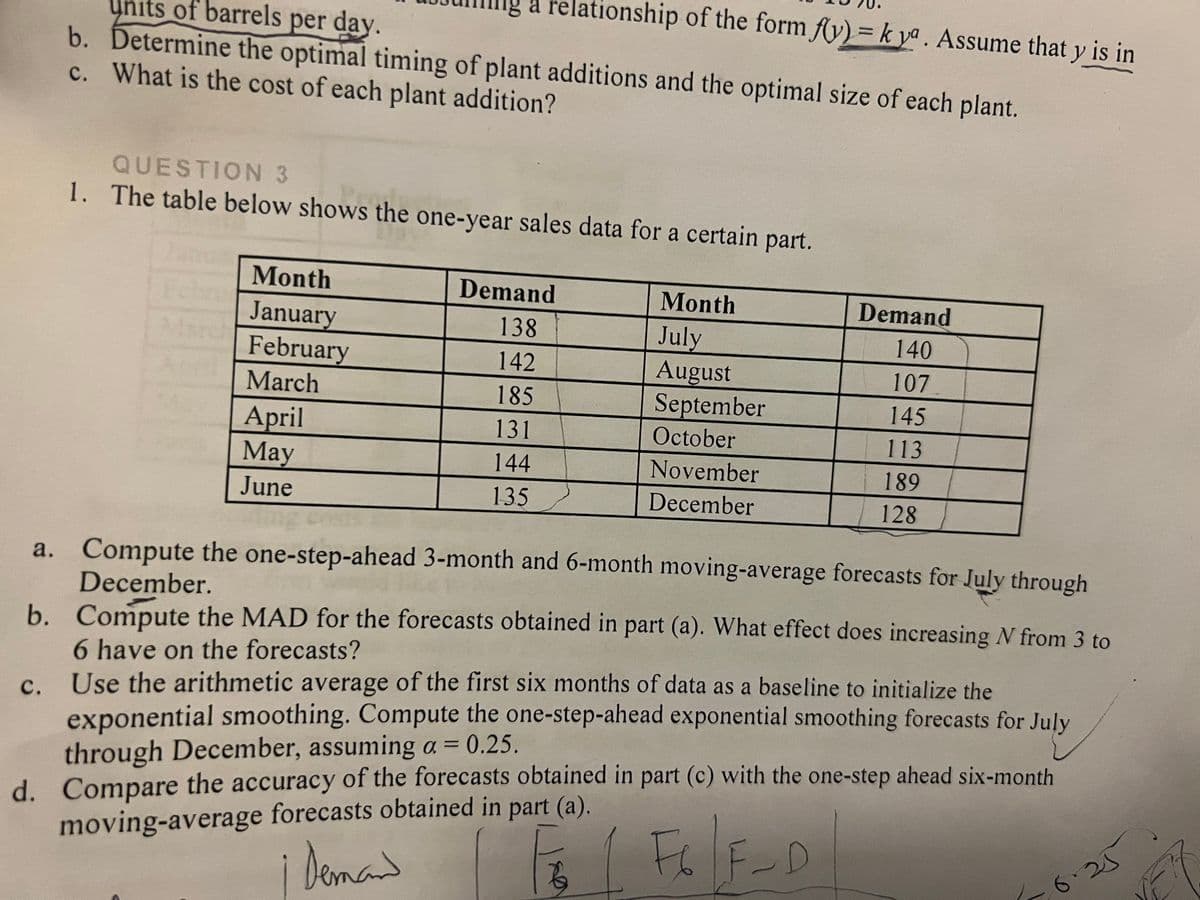
Transcribed Image Text:a relationship of the form fy) = k ya. Assume that y is in
ynits of barrels per day.
b. Determine the optimal timing of plant additions and the optimal size of each plant.
c. What is the cost of each plant addition?
QUESTION 3
1. The table below shows the one-year sales data for a certain part.
Janua
Echru
Month
Demand
Month
Demand
January
February
138
July
August
September
March
140
142
April
107
March
185
145
April
May
131
October
113
144
November
189
June
135
December
128
a. Compute the one-step-ahead 3-month and 6-month moving-average forecasts for July through
December.
b. Compute the MAD for the forecasts obtained in part (a). What effect does increasing N from 3 to
6 have on the forecasts?
c. Use the arithmetic average of the first six months of data as a baseline to initialize the
exponential smoothing. Compute the one-step-ahead exponential smoothing forecasts for July
through December, assuming a = 0.25.
d. Compare the accuracy of the forecasts obtained in part (c) with the one-step ahead six-month
moving-average forecasts obtained in part (a).
с.
i Demad
6.25
Expert Solution
Step 1
Given information:
| Month | Demand |
| January | 138 |
| February | 142 |
| March | 185 |
| April | 131 |
| May | 144 |
| June | 135 |
| July | 140 |
| August | 107 |
| September | 145 |
| October | 113 |
| November | 189 |
| December | 128 |
Note - As per guidelines we will only answer the first three subparts, please repost other subparts for more answers.

Trending now
This is a popular solution!

Step by step
Solved in 4 steps

Recommended textbooks for you
Algebra & Trigonometry with Analytic Geometry
Algebra
ISBN:
9781133382119
Author:
Swokowski
Publisher:
Cengage

Mathematics For Machine Technology
Advanced Math
ISBN:
9781337798310
Author:
Peterson, John.
Publisher:
Cengage Learning,
Algebra & Trigonometry with Analytic Geometry
Algebra
ISBN:
9781133382119
Author:
Swokowski
Publisher:
Cengage
Mathematics For Machine Technology
Advanced Math
ISBN:
9781337798310
Author:
Peterson, John.
Publisher:
Cengage Learning,