You collect data on college professors to assess whether there is a correlation between their self- reported job satisfaction (Y) and the number of courses they teach online (X). You find that these data are correlated at r = -.31, p<.05. Please use this scatterplot to answer the following questions. 1) Based on these data, can you use the number of online courses to predict levels of job satisfaction? Why or why not?
You collect data on college professors to assess whether there is a correlation between their self- reported job satisfaction (Y) and the number of courses they teach online (X). You find that these data are correlated at r = -.31, p<.05. Please use this scatterplot to answer the following questions. 1) Based on these data, can you use the number of online courses to predict levels of job satisfaction? Why or why not?

Glencoe Algebra 1, Student Edition, 9780079039897, 0079039898, 2018
18th Edition
ISBN:9780079039897
Author:Carter
Publisher:Carter
Chapter4: Equations Of Linear Functions
Section4.5: Correlation And Causation
Problem 11PPS

Related questions
Question
Transcribed Image Text:R. Cortez
Psyc 220
Practice: Correlations
Faculty job satisfaction while teaching online
8.
7.
1
3.
X: Num. classes taught online
1
2
4
7.
8.
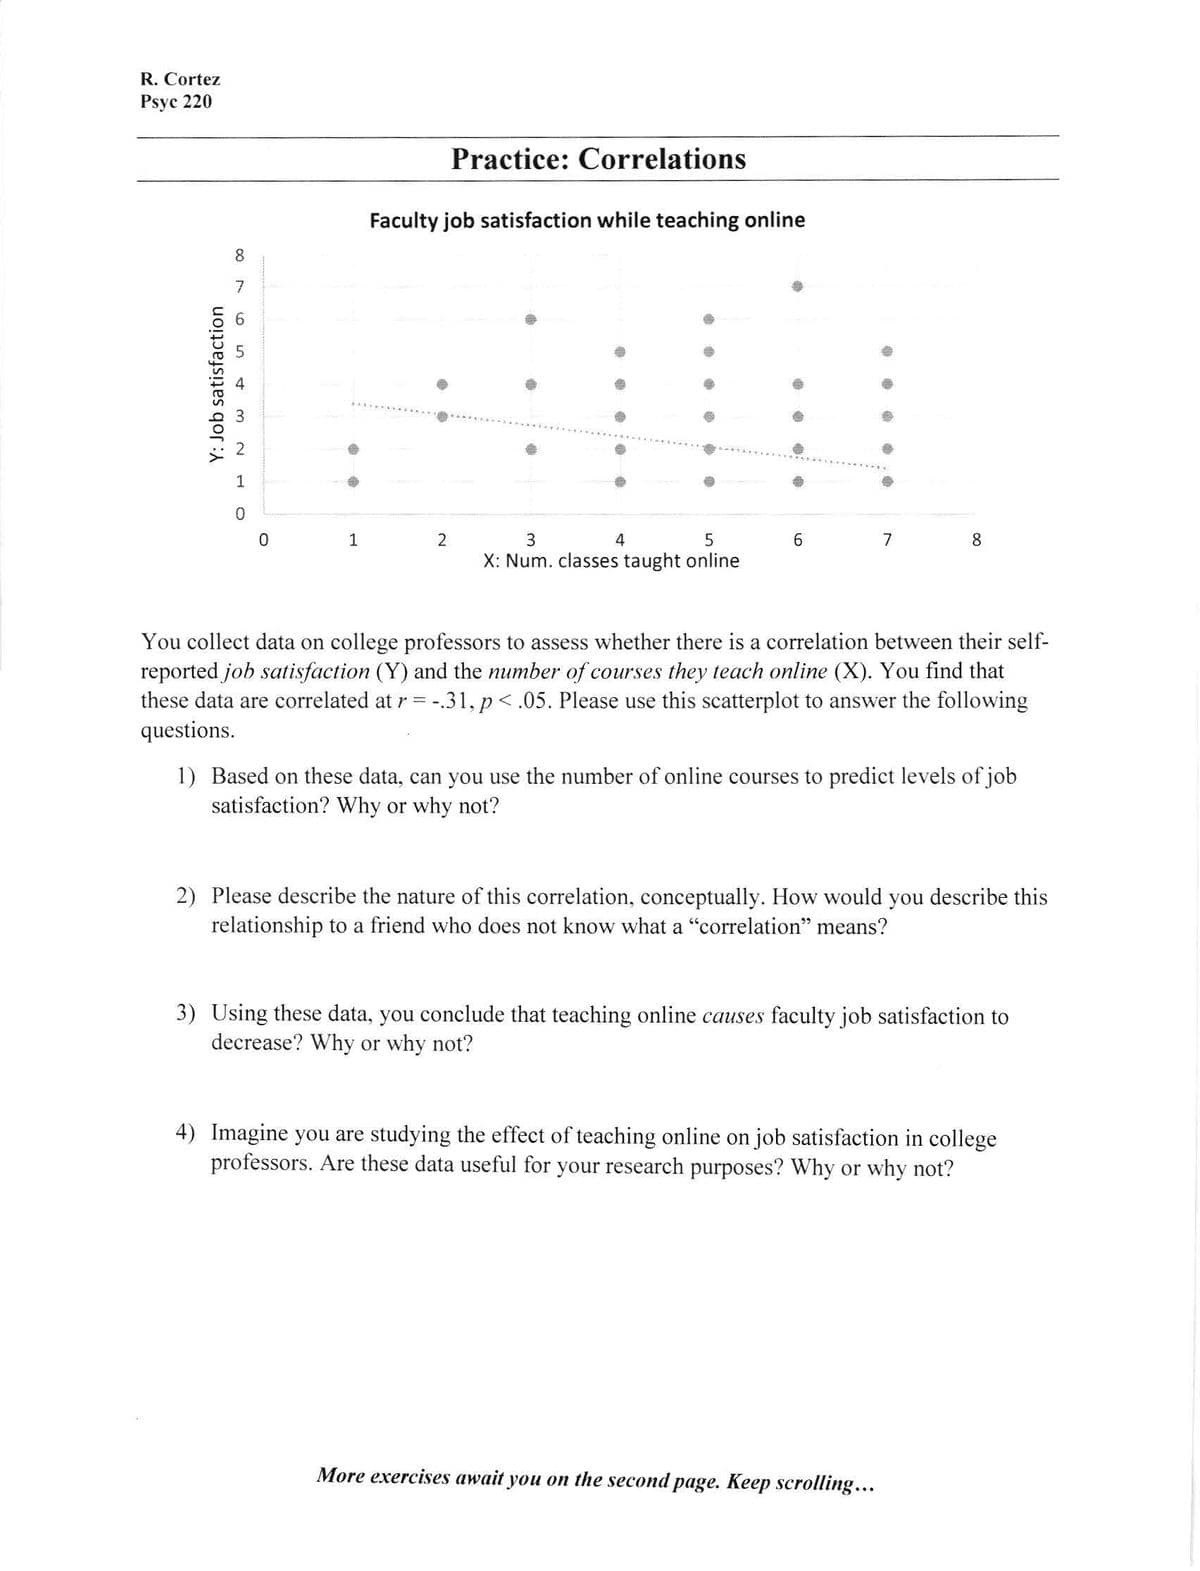
You collect data on college professors to assess whether there is a correlation between their self-
reported job satisfaction (Y) and the number of courses they teach online (X). You find that
these data are correlated at r = -.31, p< .05. Please use this scatterplot to answer the following
questions.
1) Based on these data, can you use the number of online courses to predict levels of job
satisfaction? Why or why not?
2) Please describe the nature of this correlation, conceptually. How would you describe this
relationship to a friend who does not know what a "correlation" means?
3) Using these data, you conclude that teaching online causes faculty job satisfaction to
decrease? Why or why not?
4) Imagine you are studying the effect of teaching online on job satisfaction in college
professors. Are these data useful for your research purposes? Why or why not?
More exercises await you on the second page. Keep scrolling...
Y: Job satisfaction
. . . : ..
Expert Solution
This question has been solved!
Explore an expertly crafted, step-by-step solution for a thorough understanding of key concepts.

Step by step
Solved in 3 steps with 1 images

Recommended textbooks for you
Glencoe Algebra 1, Student Edition, 9780079039897…
Algebra
ISBN:
9780079039897
Author:
Carter
Publisher:
McGraw Hill

Big Ideas Math A Bridge To Success Algebra 1: Stu…
Algebra
ISBN:
9781680331141
Author:
HOUGHTON MIFFLIN HARCOURT
Publisher:
Houghton Mifflin Harcourt
Glencoe Algebra 1, Student Edition, 9780079039897…
Algebra
ISBN:
9780079039897
Author:
Carter
Publisher:
McGraw Hill
Big Ideas Math A Bridge To Success Algebra 1: Stu…
Algebra
ISBN:
9781680331141
Author:
HOUGHTON MIFFLIN HARCOURT
Publisher:
Houghton Mifflin Harcourt