A newspaper argued in a recent article that wine and cheese were important for world history and the development of human physiology. A researcher was interested in studying if there is actually a strong positive relationship between wine and cheese consumption. The accompanying table shows a certain country's per capita cheese and wine consumption for several years. These data have a sample correlation coefficient, rounded to three decimal places, of 0.222. Using these data and a 0.05, test if the population correlation coefficient between the country's per capita consumption of cheese and wine is different from zero. What conclusions can you draw? Click the icon to view the cheese and wine consumption data. What are the correct null and alternative hypotheses? OA. Ho: p=0. H₁: p#0 OC. Ho: p=0 H₁: p>0 COD OB. Ho: #0 H₁: p=0 OD. Ho:p>0 H₁: p=0 1111
A newspaper argued in a recent article that wine and cheese were important for world history and the development of human physiology. A researcher was interested in studying if there is actually a strong positive relationship between wine and cheese consumption. The accompanying table shows a certain country's per capita cheese and wine consumption for several years. These data have a sample correlation coefficient, rounded to three decimal places, of 0.222. Using these data and a 0.05, test if the population correlation coefficient between the country's per capita consumption of cheese and wine is different from zero. What conclusions can you draw? Click the icon to view the cheese and wine consumption data. What are the correct null and alternative hypotheses? OA. Ho: p=0. H₁: p#0 OC. Ho: p=0 H₁: p>0 COD OB. Ho: #0 H₁: p=0 OD. Ho:p>0 H₁: p=0 1111

MATLAB: An Introduction with Applications
6th Edition
ISBN:9781119256830
Author:Amos Gilat
Publisher:Amos Gilat
Chapter1: Starting With Matlab
Section: Chapter Questions
Problem 1P

Related questions
Question
100%
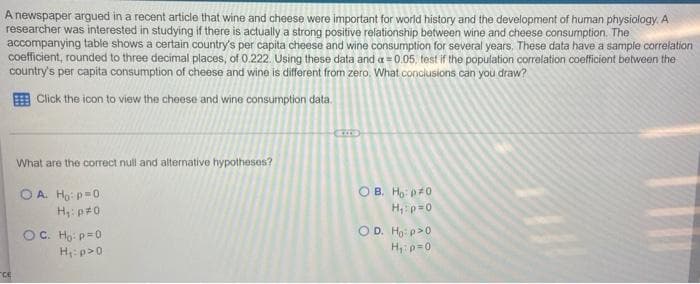
Transcribed Image Text:A newspaper argued in a recent article that wine and cheese were important for world history and the development of human physiology. A
researcher was interested in studying if there is actually a strong positive relationship between wine and cheese consumption. The
accompanying table shows a certain country's per capita cheese and wine consumption for several years. These data have a sample correlation
coefficient, rounded to three decimal places, of 0.222. Using these data and a = 0.05, test if the population correlation coefficient between the
country's per capita consumption of cheese and wine is different from zero. What conclusions can you draw?
Click the icon to view the cheese and wine consumption data.
ce
What are the correct null and alternative hypotheses?
OA. Ho: p=0
H₁: p#0
OC. Ho: p=0
H₁: p>0
OB. Ho: p=0
H₁: p=0
O D. Ho p>0
H₁: p=0
Transcribed Image Text:nu
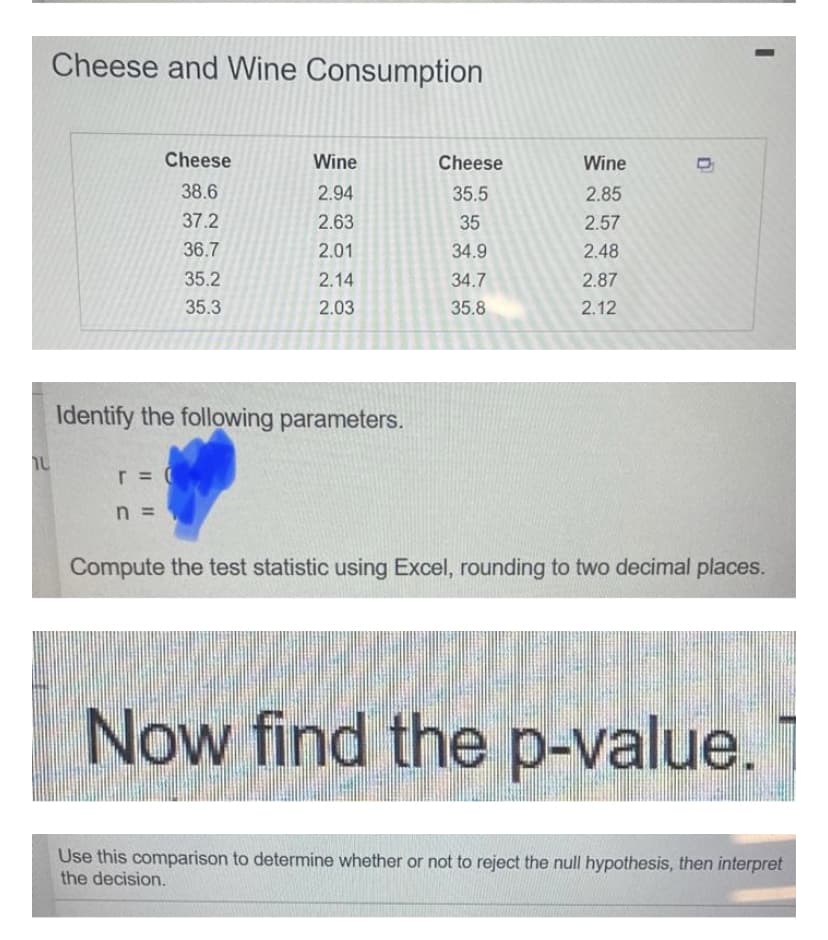
Cheese and Wine Consumption
Cheese
38.6
37.2
36.7
35.2
35.3
Wine
2.94
2.63
2.01
2.14
2.03
Identify the following parameters.
r = (
n =
Cheese
35.5
35
34.9
34.7
35.8
Wine
2.85
2.57
2.48
2.87
2.12
0
Compute the test statistic using Excel, rounding to two decimal places.
Now find the p-value.
Use this comparison to determine whether or not to reject the null hypothesis, then interpret
the decision.
Expert Solution
This question has been solved!
Explore an expertly crafted, step-by-step solution for a thorough understanding of key concepts.

This is a popular solution!

Trending now
This is a popular solution!

Step by step
Solved in 2 steps

Recommended textbooks for you
MATLAB: An Introduction with Applications
Statistics
ISBN:
9781119256830
Author:
Amos Gilat
Publisher:
John Wiley & Sons Inc

Probability and Statistics for Engineering and th…
Statistics
ISBN:
9781305251809
Author:
Jay L. Devore
Publisher:
Cengage Learning

Statistics for The Behavioral Sciences (MindTap C…
Statistics
ISBN:
9781305504912
Author:
Frederick J Gravetter, Larry B. Wallnau
Publisher:
Cengage Learning
MATLAB: An Introduction with Applications
Statistics
ISBN:
9781119256830
Author:
Amos Gilat
Publisher:
John Wiley & Sons Inc
Probability and Statistics for Engineering and th…
Statistics
ISBN:
9781305251809
Author:
Jay L. Devore
Publisher:
Cengage Learning
Statistics for The Behavioral Sciences (MindTap C…
Statistics
ISBN:
9781305504912
Author:
Frederick J Gravetter, Larry B. Wallnau
Publisher:
Cengage Learning

Elementary Statistics: Picturing the World (7th E…
Statistics
ISBN:
9780134683416
Author:
Ron Larson, Betsy Farber
Publisher:
PEARSON

The Basic Practice of Statistics
Statistics
ISBN:
9781319042578
Author:
David S. Moore, William I. Notz, Michael A. Fligner
Publisher:
W. H. Freeman

Introduction to the Practice of Statistics
Statistics
ISBN:
9781319013387
Author:
David S. Moore, George P. McCabe, Bruce A. Craig
Publisher:
W. H. Freeman