You decide to take two baseball players' percentages of strikes to see if there is a difference. Gavin threw 1623 pitches and 836 were called strikes, while Grayson threw 1493 pitches and made 725 strikes. a. Assuming all conditions were met, construct and interpret a 95% confidence interval to determine their difference in proportions of strikes thrown. b. Based only on your results from part a, what can you conclude about a significance test with the following null and alternative hypotheses: H,: P1 = P2 Ha: P1 > P2
You decide to take two baseball players' percentages of strikes to see if there is a difference. Gavin threw 1623 pitches and 836 were called strikes, while Grayson threw 1493 pitches and made 725 strikes. a. Assuming all conditions were met, construct and interpret a 95% confidence interval to determine their difference in proportions of strikes thrown. b. Based only on your results from part a, what can you conclude about a significance test with the following null and alternative hypotheses: H,: P1 = P2 Ha: P1 > P2

Glencoe Algebra 1, Student Edition, 9780079039897, 0079039898, 2018
18th Edition
ISBN:9780079039897
Author:Carter
Publisher:Carter
Chapter4: Equations Of Linear Functions
Section: Chapter Questions
Problem 8SGR

Related questions

Topic Video
Question
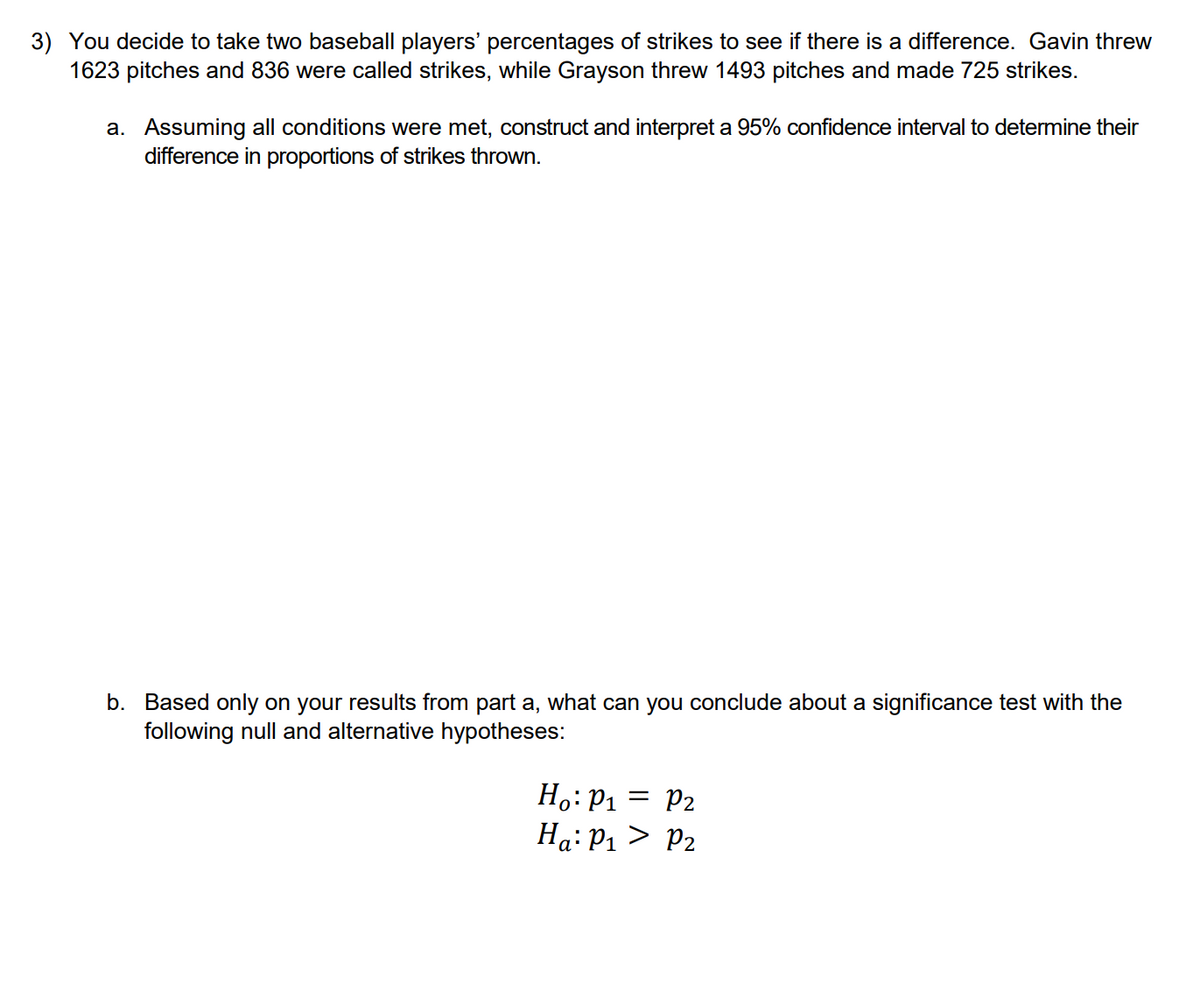
Transcribed Image Text:3) You decide to take two baseball players' percentages of strikes to see if there is a difference. Gavin threw
1623 pitches and 836 were called strikes, while Grayson threw 1493 pitches and made 725 strikes.
a. Assuming all conditions were met, construct and interpret a 95% confidence interval to determine their
difference in proportions of strikes thrown.
b. Based only on your results from part a, what can you conclude about a significance test with the
following null and alternative hypotheses:
Ho:P1
= P2
Ha: P1 > P2
Expert Solution
This question has been solved!
Explore an expertly crafted, step-by-step solution for a thorough understanding of key concepts.

Step by step
Solved in 3 steps

Knowledge Booster


Learn more about
Need a deep-dive on the concept behind this application? Look no further. Learn more about this topic, statistics and related others by exploring similar questions and additional content below.Recommended textbooks for you
Glencoe Algebra 1, Student Edition, 9780079039897…
Algebra
ISBN:
9780079039897
Author:
Carter
Publisher:
McGraw Hill

College Algebra (MindTap Course List)
Algebra
ISBN:
9781305652231
Author:
R. David Gustafson, Jeff Hughes
Publisher:
Cengage Learning
Glencoe Algebra 1, Student Edition, 9780079039897…
Algebra
ISBN:
9780079039897
Author:
Carter
Publisher:
McGraw Hill
College Algebra (MindTap Course List)
Algebra
ISBN:
9781305652231
Author:
R. David Gustafson, Jeff Hughes
Publisher:
Cengage Learning